Category: san francisco commercial real estate (137)

4th Quarter 2019 Industrial Market Summary
-San Francisco & Peninsula

The reported industrial vacancy rates in San Francisco and surrounding Peninsula areas increased to 4.1% at the end of Q4 2019 (up from 3.5% in Q3 2019). The Bayshore Corridor of San Francisco vacancy rate increased to 3.3% in Q4 (up from .9% in Q3 2019). The San Francisco/Peninsula market reported a delivery of 34,200+/- square feet of new construction, and 2,772,511 square feet of product under construction, primarily in South San Francisco, Brisbane & Daly City. The industrial core of San Francisco (Bayshore / Potrero Hill / Dogpatch) reported 238,000+/- square feet of product under construction, with zero deliveries, or construction starts.

Q4 2019 ended with averaged over-all asking rents (industrial and flex) remaining at $2.26 per square foot, representing no change over the previous quarter. Comparatively, current average US industrial asking rents are reported as $.72 per square foot (no change from Q3 2019). Asking rents specific to warehouse product dipped slightly to $1.83 psf at the end of Q4 (down from $1.88 Q3). Quoted daily warehouse asking rents for the Bayshore Corridor at the end of Q4 increased to $2.10 psf from $2.04 psf at the end of Q3. Year-over-year market rents have increased by 2.7% for the San Francisco/Peninsula industrial/flex market.

Q4 2019 Industrial sale transactions are down from Q3 2019 with $174M in sales volume averaging $362 per square foot compared to $440M in sales averaging $360 per square foot in Q3 2019. CAP rates averaged 4.7% in Q4, representing no change over the previous quarter. National CAP rates have remained at 6.7% for Q1-Q4 2019.

Calco Commercial has leased and sold 1,505,690+/- square feet of industrial, flex, office and land in 2019 comprising 83 transactions, with 407,846+/- square feet and 24 transactions in Q4 alone. Following are the notable Q4 2019 transactions: 1000 25th Street, San Francisco (18,432 +/- sf industrial lease), 195 Bayshore Boulevard, San Francisco (21,000+/- sf industrial lease), and 415 E. Grand, South San Francisco (21,000/- sf industrial lease), and 464 9th Street, San Francisco (16,080+/- commercial/sale). Calco Commercial is a leading industrial & commercial real estate firm with decades of experience in Landlord /Owner representation, and repositioning assets into net leased properties with in-place income streams. Let us help make the most of your real estate properties and investments.

If you would like to discuss your real estate options, or would simply like more information related to current market conditions, please call our office a 415.970.0000, or directly contact one of our professionals.

CLICK HERE FOR THE FULL REPORT: Q4 Industrial Market Report

The reported industrial vacancy rates in San Francisco and surrounding Peninsula areas decreased to 3.5% at the end of Q3 2019 (down from 3.8% in Q2 2019). The Bayshore Corridor of San Francisco witnessed yet another decrease in vacancy to a sub 1% rate of .5% (down from .9% in Q2 2019). The San Francisco/Peninsula market reported a delivery of 21,807+/- square feet of new construction, and 2,568,754 square feet of product under construction, primarily in South San Francisco, Brisbane & Daly City. The industrial core of San Francisco (Bayshore / Potrero Hill / Dogpatch) reported 56,121 square feet of product under construction, with zero deliveries, or construction starts.

Q3 2019 ended with averaged over-all asking rents (industrial and flex) down from $2.30 per square foot to $2.26 per square foot, representing an 1.9% decrease over the previous quarter. Comparatively, current average US industrial asking rents are reported as $.72 per square foot (up from $.71 at the end of Q2 2019). Asking rents specific to warehouse product remained at $1.88 psf at the end of Q3 (no change from Q2). Quoted daily warehouse asking rents for the Bayshore Corridor at the end of Q3 decreased to $1.97 psf from $2.04 psf in Q2. Year-over-year market rents have decreased by 3.9% for the San Francisco/Peninsula industrial/flex market.

Q3 2019 Industrial sale transactions are up from Q2 2019 with $408M in sales volume averaging $334.00 per square foot compared to $308M in sales averaging $328.61 per square foot in Q2 2019. CAP rates averaged 4.9% in Q3 & Q2 2019, representing a minimal increase over Q1 2019 CAP rates of 4.85%. National CAP rates have remained at 6.7% for Q1-Q3 2009.

Calco Commercial has leased and sold 1,097,884+/- square feet of industrial, flex, office and land in 2019 comprising 59 transactions, with 179,124+/- square feet and 16 transactions in Q3 alone. Following are the notable Q3 2019 transactions: 253 Utah Avenue, South San Francisco (14,250 +/- sf industrial lease), 81 Dorman Avenue, San Francisco (12,500+/- sf industrial lease), and 3012 Spring Street, Redwood City (5,000/- sf commercial/sale), and 4870 Centennial Boulevard, Colorado Springs (50,000+/- commercial/sale). Calco Commercial is a leading industrial & commercial real estate firm with decades of experience in Landlord /Owner representation, and repositioning assets into net leased properties with in-place income streams. Let us help make the most of your real estate properties and investments.

If you would like to discuss your real estate options, or would simply like more information related to current market conditions, please call our office a 415.970.0000, or directly contact one of our professionals.

Click here for the full report: Q3 2019 Industrial Market Report

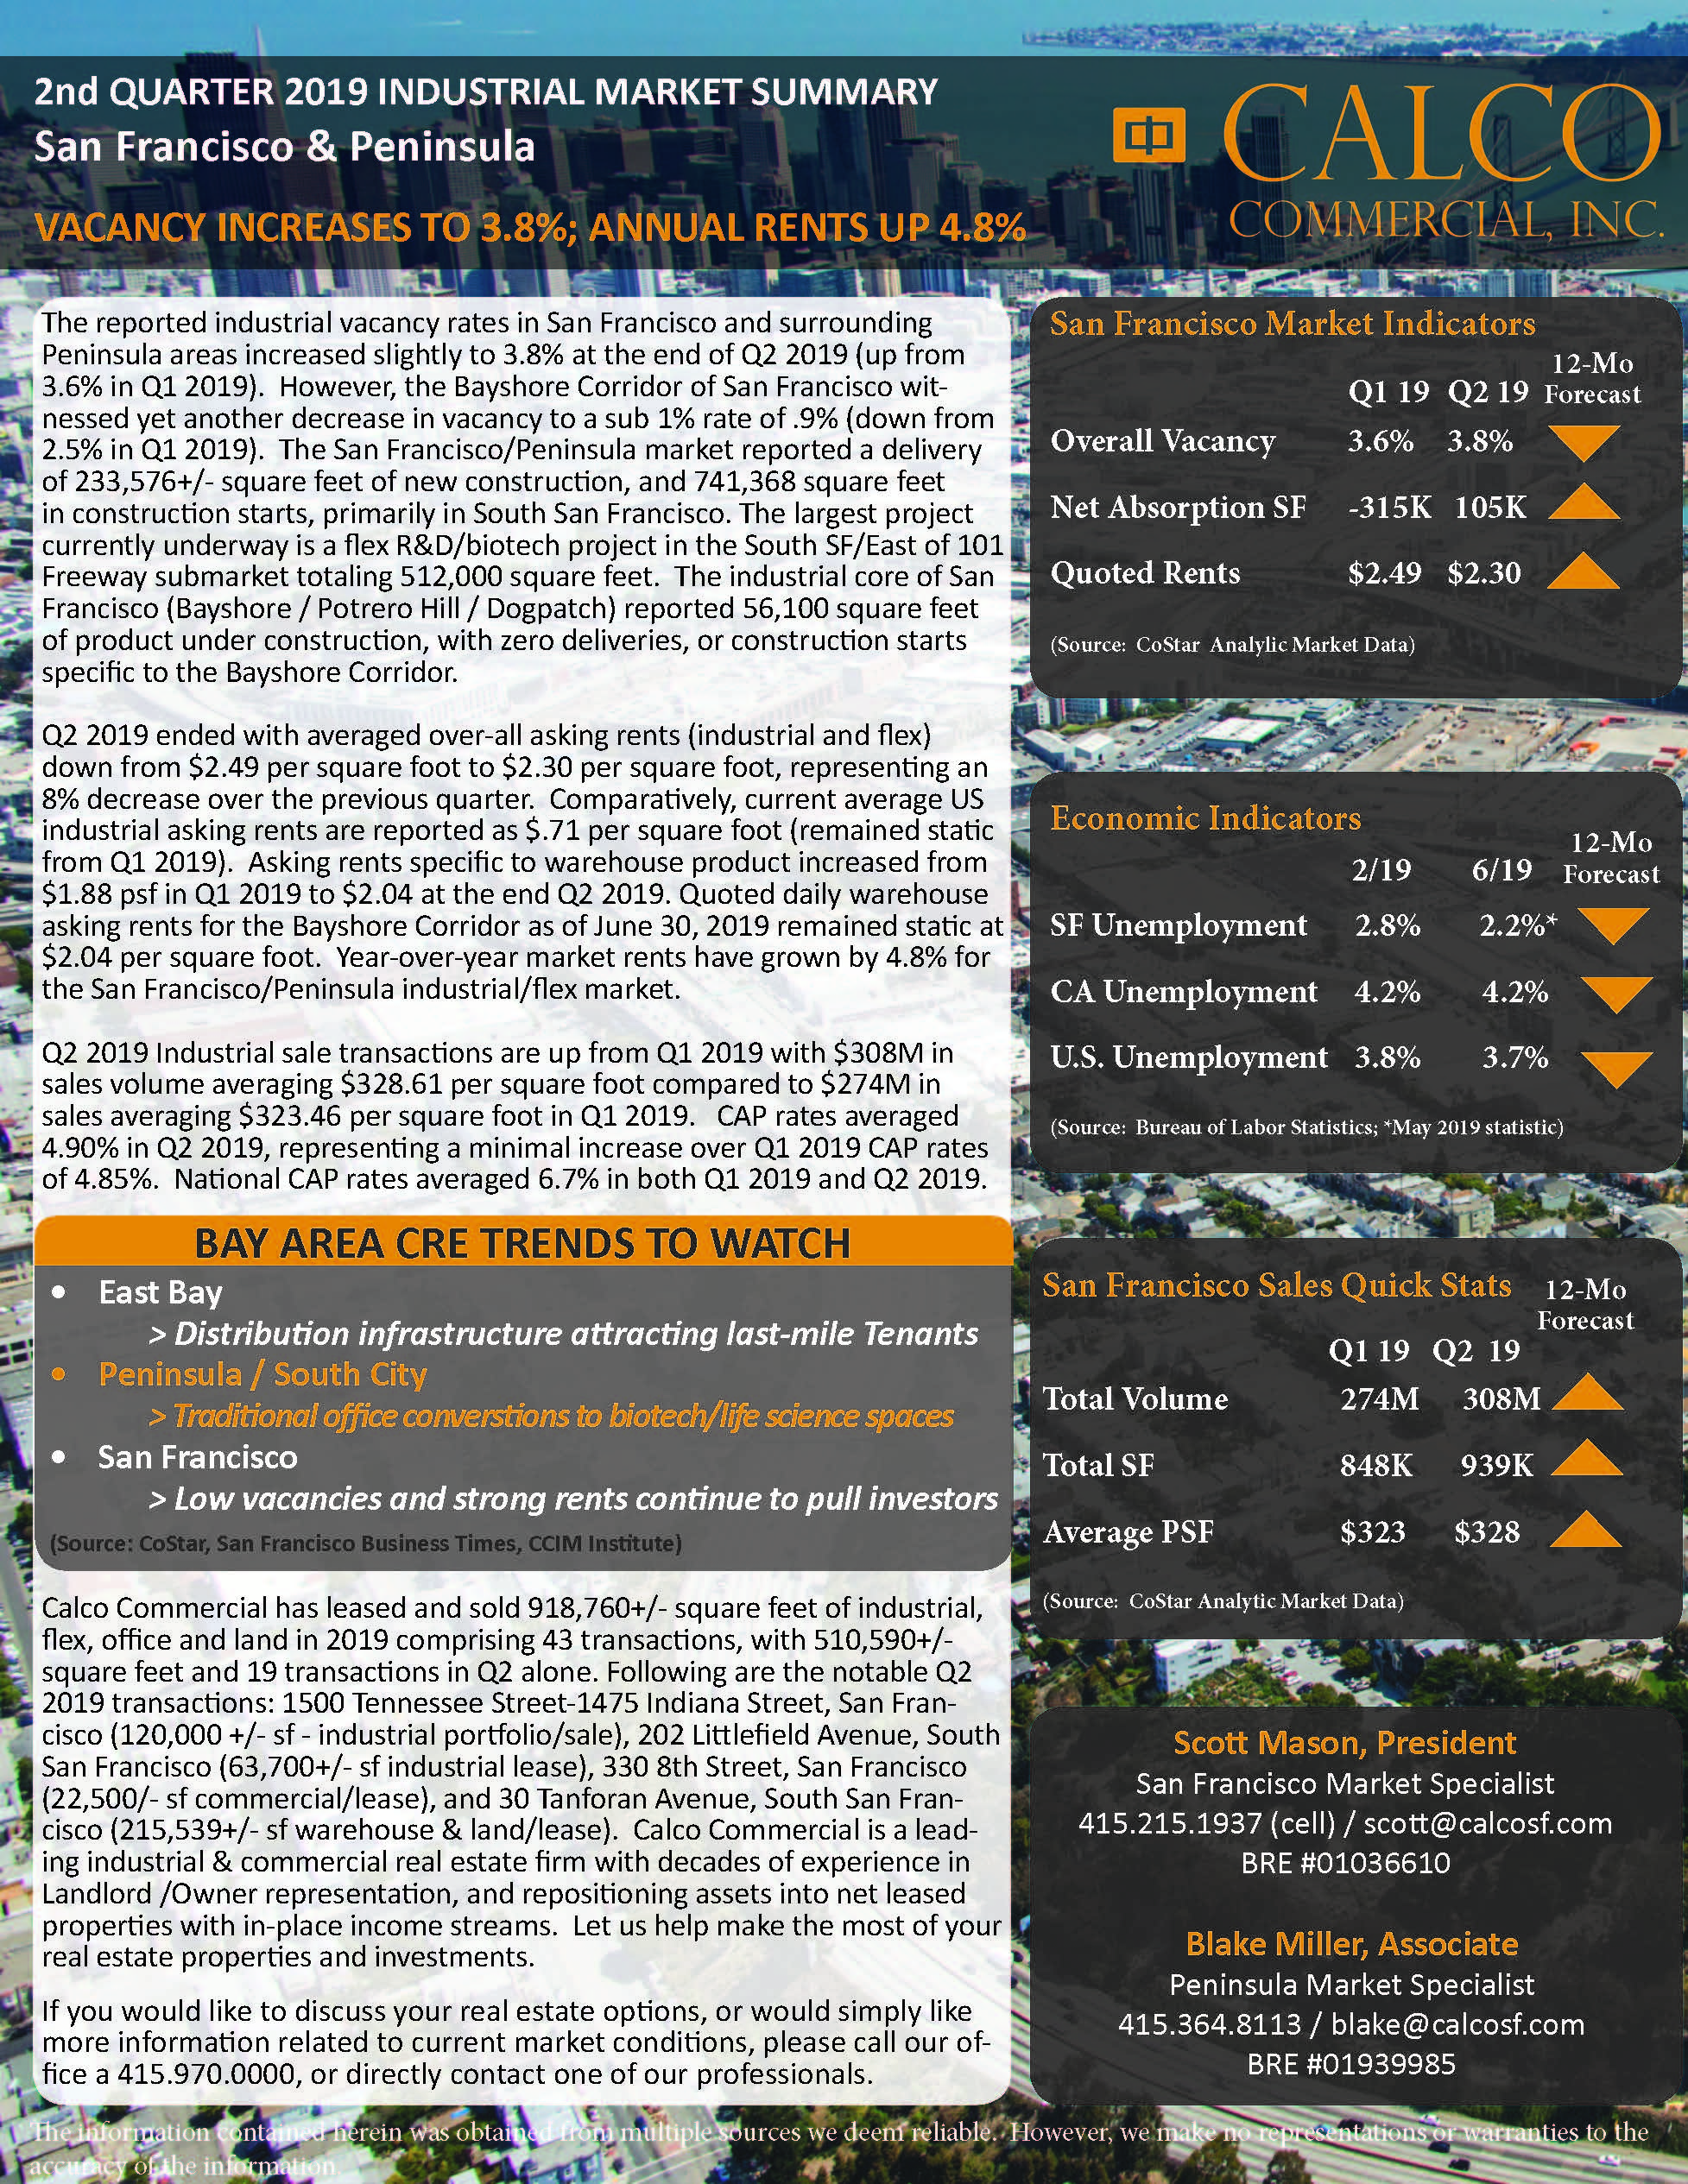
The reported industrial vacancy rates in San Francisco and surrounding Peninsula areas increased slightly to 3.8% at the end of Q2 2019 (up from 3.6% in Q1 2019). However, the Bayshore Corridor of San Francisco witnessed yet another decrease in vacancy to a sub 1% rate of .9% (down from 2.5% in Q1 2019). The San Francisco/Peninsula market reported a delivery of 233,576+/- square feet of new construction, and 741,368 square feet in construction starts, primarily in South San Francisco. The largest project currently underway is a flex R&D/biotech project in the South SF/East of 101 Freeway submarket totaling 512,000 square feet. The industrial core of San Francisco (Bayshore / Potrero Hill / Dogpatch) reported 56,100 square feet of product under construction, with zero deliveries, or construction starts specific to the Bayshore Corridor.

Q2 2019 ended with averaged over-all asking rents (industrial and flex) down from $2.49 per square foot to $2.30 per square foot, representing an 8% decrease over the previous quarter. Comparatively, current average US industrial asking rents are reported as $.71 per square foot (remained static from Q1 2019). Asking rents specific to warehouse product increased from $1.88 psf in Q1 2019 to $2.04 at the end Q2 2019. Quoted daily warehouse asking rents for the Bayshore Corridor as of June 30, 2019 remained static at $2.04 per square foot. Year-over-year market rents have grown by 4.8% for the San Francisco/Peninsula industrial/flex market.

Q2 2019 Industrial sale transactions are up from Q1 2019 with $308M in sales volume averaging $328.61 per square foot compared to $274M in sales averaging $323.46 per square foot in Q1 2019. CAP rates averaged 4.90% in Q2 2019, representing a minimal increase over Q1 2019 CAP rates of 4.85%. National CAP rates averaged 6.7% in both Q1 2019 and Q2 2019.

Calco Commercial has leased and sold 918,760+/- square feet of industrial, flex, office and land in 2019 comprising 43 transactions, with 510,590+/- square feet and 19 transactions in Q2 alone. Following are the notable Q2 2019 transactions: 1500 Tennessee Street-1475 Indiana Street, San Francisco (120,000 +/- sf – industrial portfolio/sale), 202 Littlefield Avenue, South San Francisco (63,700+/- sf industrial lease), 330 8th Street, San Francisco (22,500/- sf commercial/lease), and 30 Tanforan Avenue, South San Francisco (215,539+/- sf warehouse & land/lease). Calco Commercial is a leading industrial & commercial real estate firm with decades of experience in Landlord /Owner representation, and repositioning assets into net leased properties with in-place income streams. Let us help make the most of your real estate properties and investments.

If you would like to discuss your real estate options, or would simply like more information related to current market conditions, please call our office a 415.970.0000, or directly contact one of our professionals.

Click here for the full report: Q2 2019 Industrial Market Report – San Francisco & Peninsula

Source: CoStar News
By: Molly Armbrister

Life Science Industry Elbows Its Way Into Tight Bay Area Property Market
Rock-Bottom Vacancy Rates Pervade the San Francisco Peninsula

Like the organisms it studies, the life science industry in the San Francisco Bay is adapting to its changing surroundings.

Stiff competition from well-heeled tech giants such as Salesforce and Uber in areas such as downtown San Francisco is preventing the life sciences industry, which has had a foothold in the region for decades, from elbowing its way into commercial real estate around the city. So the life science industry has begun looking south, where developers are planning unprecedented ways to accommodate the industry, one of the fastest-growing in the United States, with the area’s first high-rise for science firms.

“There’s a confluence of industries that are booming all at the same time,” said Marc Pope, executive director at commercial real estate firm Cushman & Wakefield. “Life science, technology, automotive technology. In some ways, they’re competing for space. Elsewhere, traditional office is being bought and converted to lab space.”

The life science industry combines health care and technology into a field that seems in some ways recession-proof and requires large amounts of specialized real estate. Life science employment grew nationwide by 4.5% between 2010 and 2018, compared with total employment growth of 1.7%, according to the U.S. Bureau of Labor Statistics. Since 2000, the life science sector has grown nearly five times as fast as the rest of the economy, adding 85,000 jobs, according to a Cushman report.

Organic growth stemming from an aging population that wants and needs new treatments for ailments, and expansion enabled by technological advances in the field, resulted in a growing share of life science space needed in several of the country’s biggest markets. The way different south Bay Area cities are dealing with the region’s industry growth could provide a window into how other top industry cities such as Boston and San Diego deal with the space crunch in coming years.

While San Francisco and the city of South San Francisco are both almost fully occupied, the cities are each handling the sector’s growth differently. Life science companies aren’t receiving much assistance in their competition with the major tech companies in San Francisco, but they are being welcomed with open arms by the adjacent city of South San Francisco and others eager to capture the spillover demand with new development, which could spur even more expansion in the future.

According to CoStar data, San Francisco’s Mission Bay neighborhood property market, for example, is about as tight as it can get: The overall office vacancy rate in that neighborhood is 0.3%.

Mission Bay is part of an area in San Francisco that was targeted for life science companies by a 2008 plan passed by the City and County of San Francisco that created a life sciences and medical special use district.

But that overlay didn’t exclude other uses, and 10 years after it was put in place, the development capacity there is largely maxed out by the tech giants that have given the city its reputation, Pope said.

Among the biggest new tenants in Mission Bay is ride-hailing app maker Uber, which is planning to take up 1 million square feet of new development adjacent to Chase Center Arena, the $1.4 billion multi-purpose stadium and future home of the NBA’s Golden State Warriors that is scheduled to open before the 2019-2020 season.

It reflects the way new development in San Francisco is getting scooped up by these major tech companies, who offer a cache — and sometimes a rental rate — that many life science companies don’t have, forcing the firms to look elsewhere if they want to expand.

Going Vertical

Contrast that with the city of South San Francisco, which in 1976 was dubbed the “Birthplace of Biotechnology” by Genentech, the bioscience company that was acquired by Roche Pharmaceuticals in 2009. There, developers are doing something unprecedented to find a home for life science companies: They’re going vertical.

A 20-story development called Genesis Towers has been taken over by life science companies looking for space. The two-building property was originally designed as office space and was supposed to be completed during the recession, but the economy got in the way, Pope said.

Now, it has been developed into two life science towers with a third planned. Shortly after the conversion was finished, the space was fully leased, according to Cole Speers, research analyst for Cushman & Wakefield in the Bay Area.

Going vertical on life science space is rare, as the properties have historically been low-slung, sprawling developments akin to industrial space.

Life science real estate, though, can include more than just office space, sometimes branching out into flex industrial and converted office spaces. Cushman’s numbers for Mission Bay life science property specifically show there is no vacancy in that neighborhood for life science real estate.

And because of its connection to the health care industry, which is largely viewed as a mostly recession-proof field because people will always need health care regardless of the economic outlook, life science is seen as a safe place to invest capital, whether that’s in new businesses or in real estate to house them.

Boston remains the U.S. life science capital, with companies there attracting $15.5 billion worth of venture capital funding from 2010 to 2018, but San Francisco and the peninsula are right behind, with $15 billion, according to venture capital tracking website PitchBook.

And while Boston has the lowest vacancy rate for life science of any market in the country at 0.7%, the biggest drop off in vacancy rate occurred in San Francisco, falling to 6.2% fourth quarter last year from 18.3% in the same quarter of 2008, according to data from Cushman.

The development activity and need for space is not expected to recede any time soon, either. And with the percentage of people aged 65 and older projected to rise to more than 20% by 2030, the industry is expected to grow even more, further increasing the need for real estate.

Link to article: Life Science Industry Elbows Its Way Into Tight Bay Area Property Market

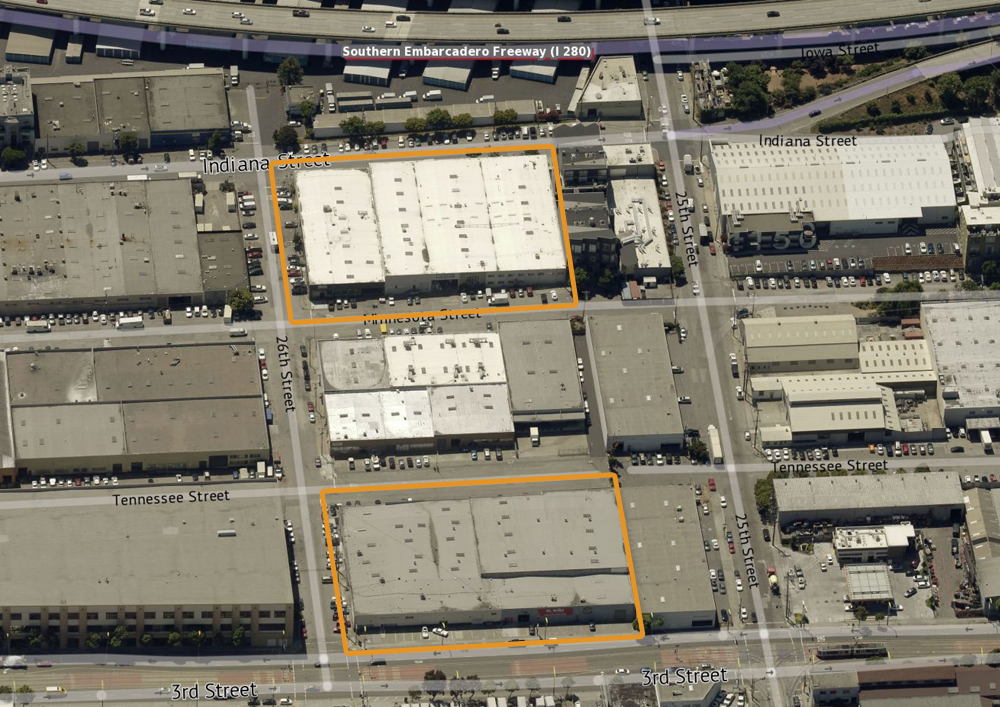
Scott Mason of Calco Commercial has represented a multi-property sale in Potrero Hill including: 1400-1496 Minnesota Street, 1475 Indiana Street, 1050-1090 26th Street, 1501-1599 Tennessee Street, 2930-2990 3rd Street & 826 26th Street. Comprised of nearly two city blocks, and multiple units totaling 120,000+/- square feet, the properties recently sold for $47,750,000.

The subject properties are situated in a very desirable Potrero Hill/Dogpatch location near the 3rd Street corridor light-rail, I-280, restaurants, cafes and other specialty retail exclusive to San Francisco. The buildings include highly functional industrial units with high ceilings, concrete construction, dock-high and drive-in loading capabilities. The portfolio had been held by BIC Bisco for 45+ years, and was acquired by Terreno Realty Corporation.

Click here for the Sale Profile: 1400 Minnesota – 1501 Tennessee SOLD

Source: CoStar News
By: Jesse Gundersheim

San Francisco added significantly more jobs in 2018 than first reported, and received the strongest upward revision among all major markets in the country.

On the heels of recent tech expansions in San Francisco’s office market, the city added 3.9% more workers last year over 2017.

The U.S. Bureau of Labor Statistics (BLS) revised its job growth statistics for 2018, recently, as it does every year after giving an early tally. Initially, the BLS estimated that San Francisco’s metropolitan division added 24,500 jobs, or a 2.2% increase. Revised data shows that San Francisco – including San Mateo County – actually added closer to 43,900 jobs in 2018.

The stronger numbers in job growth more closely align with the occupancy gains seen in San Francisco’s office market, where 4.9 million square feet were added in 2018.

Major employers in San Francisco such as Facebook, Uber and Google have already secured office space for future growth, providing capacity to grow the area’s workforce in 2019 and beyond.

Job growth was stronger from 2012 through 2015 than it is today, but it remains solid. As long as venture capital investment pours into locally based startups, and established tech companies increase profitability, the tech companies attracting highly skilled workers to San Francisco from around the world will continue to fuel local job growth.

As of the latest BLS release providing preliminary data for March 2019, San Francisco’s 12-month gain in employment registers 3.7%, close to the 3.9% of 2018. Job growth grew nationally by 1.8%.

Link to article: San Francisco’s 2018 Job Growth Revised

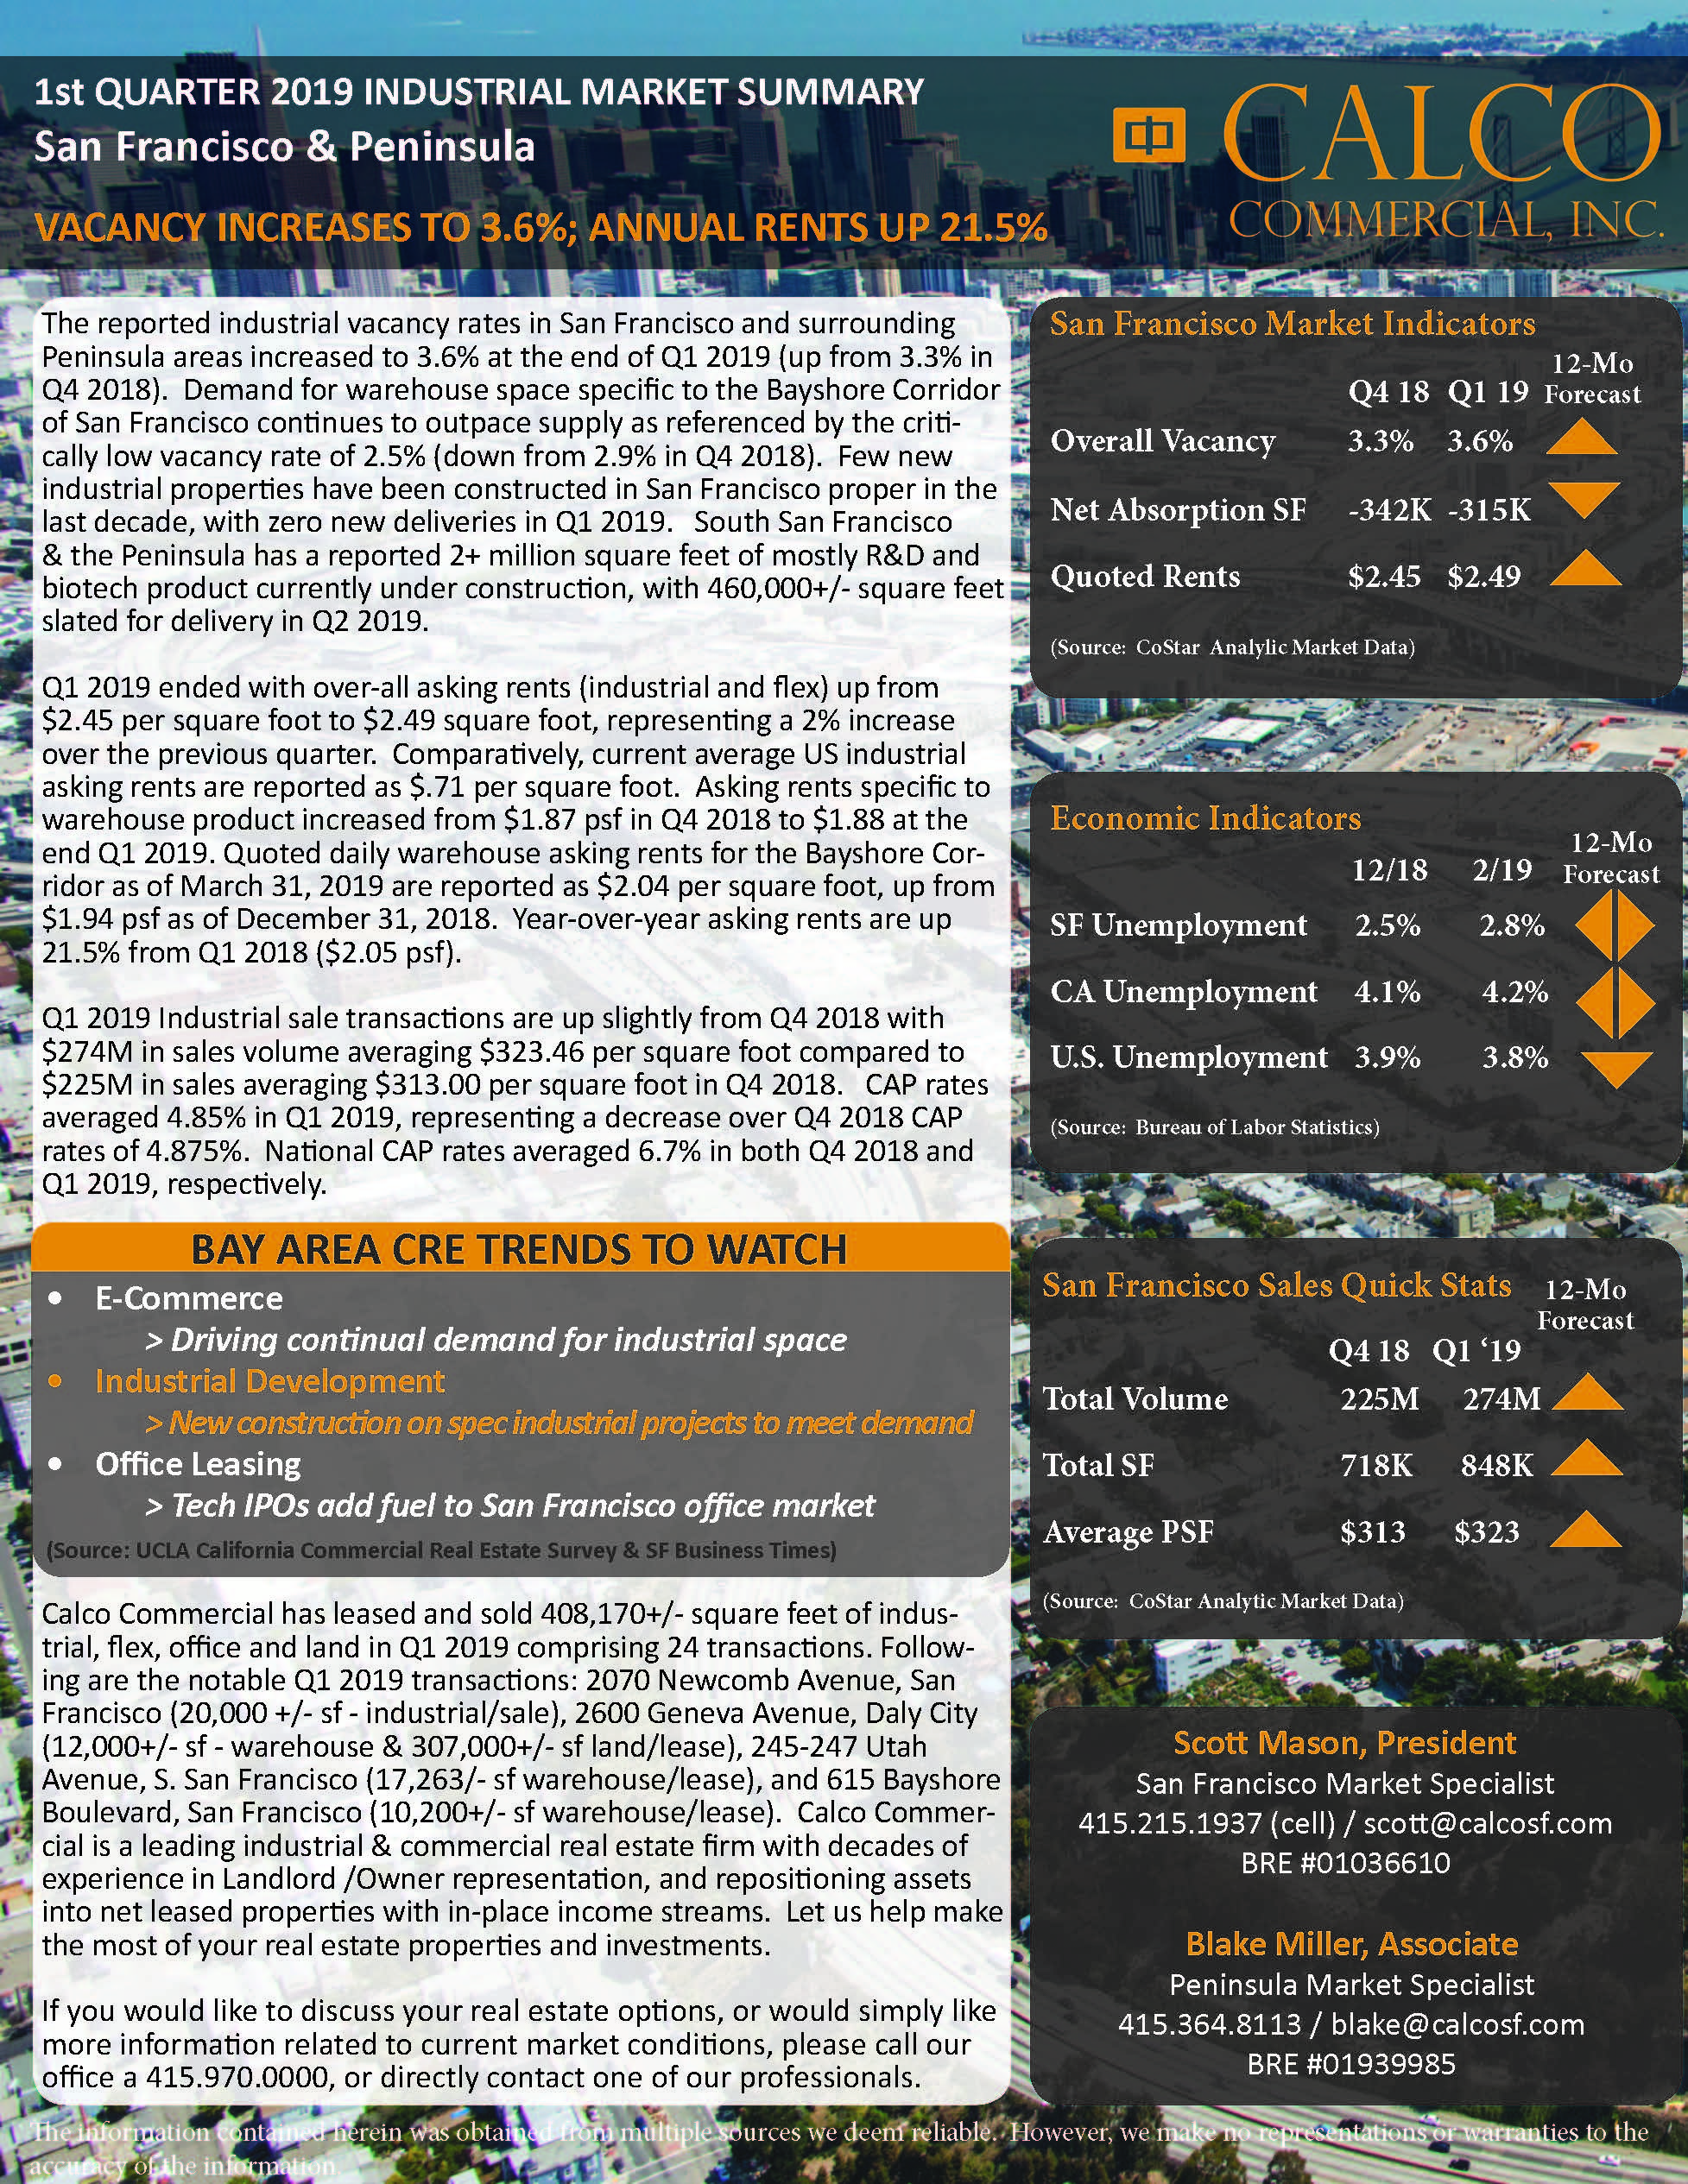
The reported industrial vacancy rates in San Francisco and surrounding Peninsula areas increased to 3.6% at the end of Q1 2019 (up from 3.3% in Q4 2018). Demand for warehouse space specific to the Bayshore Corridor of San Francisco continues to outpace supply as referenced by the critically low vacancy rate of 2.5% (down from 2.9% in Q4 2018). Few new industrial properties have been constructed in San Francisco proper in the last decade, with zero new deliveries in Q1 2019. South San Francisco & the Peninsula has a reported 2+ million square feet of mostly R&D and biotech product currently under construction, with 460,000+/- square feet slated for delivery in Q2 2019.

Q1 2019 ended with over-all asking rents (industrial and flex) up from $2.45 per square foot to $2.49 square foot, representing a 2% increase over the previous quarter. Comparatively, current average US industrial asking rents are reported as $.71 per square foot. Asking rents specific to warehouse product increased from $1.87 psf in Q4 2018 to $1.88 at the end Q1 2019. Quoted daily warehouse asking rents for the Bayshore Corridor as of March 31, 2019 are reported as $2.04 per square foot, up from $1.94 psf as of December 31, 2018. Year-over-year asking rents are up 21.5% from Q1 2018 ($2.05 psf).

Q1 2019 Industrial sale transactions are up slightly from Q4 2018 with $274M in sales volume averaging $323.46 per square foot compared to $225M in sales averaging $313.00 per square foot in Q4 2018. CAP rates averaged 4.85% in Q1 2019, representing a decrease over Q4 2018 CAP rates of 4.875%. National CAP rates averaged 6.7% in both Q4 2018 and Q1 2019, respectively.

Calco Commercial has leased and sold 408,170+/- square feet of industrial, flex, office and land in Q1 2019 comprising 24 transactions. Following are the notable Q1 2019 transactions: 2070 Newcomb Avenue, San Francisco (20,000 +/- sf – industrial/sale), 2600 Geneva Avenue, Daly City (12,000+/- sf – warehouse & 307,000+/- sf land/lease), 245-247 Utah Avenue, S. San Francisco (17,263/- sf warehouse/lease), and 615 Bayshore Boulevard, San Francisco (10,200+/- sf warehouse/lease). Calco Commercial is a leading industrial & commercial real estate firm with decades of experience in Landlord /Owner representation, and re-positioning assets into net leased properties with in-place income streams. Let us help make the most of your real estate properties and investments.

If you would like to discuss your real estate options, or would simply like more information related to current market conditions, please call our office a 415.970.0000, or directly contact one of our professionals.

Click here for the full Q1 Market Report 2019: Q1 2019 Industrial Market Report

Source: CoStar
By: Diana Bell

Prologis, the country’s largest owner of industrial real estate, is raising its projected earnings for the coming year by more than 2% as it pursues further rent increases and seeks to capitalize on a preference for smaller warehouse developments.

The real estate investment trust, headquartered in San Francisco, said rent growth will be about 4% globally, principally driven by the United States, though Europe is expected to outperform later in the year, Chief Financial Officer Thomas Olinger said Tuesday on a conference call with analysts discussing first-quarter financial results.

Prologis plans to spend $2 billion on starting development and $600 million on acquisitions but seeks to reduce its ownership in open-ended European funds from 28 percent to 24 percent to accommodate “partners and bring ownership in line” with a long-term target of 15% on the continent, Olinger said.

The REIT signaled a focus on smaller-sized warehouse space, with only about 25% of its portfolio comprising big-box regional facilities over 250,000 square feet. About two-thirds are less than 250,000 square feet.

“We are seeing higher rent change on roll under 250,000 square feet versus bigger box, and that spread is accelerating. We are well-positioned to capture that opportunity,” said Olinger.

Chairman Hamid Moghadam doesn’t see weakness in large space demand but said “there are some markets on the periphery like outlying corridors of Chicago where there are a lot of big buildings and market rent is softer now until those buildings get absorbed.”

The executives declined to name locations Prologis is considering, but Moghadam said the REIT is staying out of overdeveloped markets.

“The big boxes got their growth early in the recovery cycle. They are up significantly on 40% to 50% in the past four to five years. Now they are taking a back seat to the medium and smaller spaces,” he said.

The REIT’s strategy this year will be to push rents up. “Don’t be surprised if you see occupancy be a little lower throughout the year,” said Olinger. “We are going to make the right long-term decision, which is going to be pushing rents and extending term.” Prologis expects to end the year with an uptick in occupancy to 97.5%.

As the first developer to build a multistory warehouse in the United States, Prologis has faced headwinds with leasing the three-story, 589,000-square-foot Seattle building known as Prologis Georgetown Crossroads, where it is asking for rents in the range of $1.30 to over $2 a square foot.

Of the Seattle property, Olinger said, “We have done a 100,000-square-foot lease in this asset, and one lesson we’ve learned about this is there is a process that we have to go through with customers. It is a new product in a new location. We need to get a premium and we think we’ll get that premium, but deal gestation periods are long and they will continue to be long until customers are basically more accustomed to this product.”

The REIT said it will pursue opportunities with Seattle-based online retailer Amazon, its largest customer.

“Broadly we are seeing customers like Amazon and other customers focused on e-commerce with some network rollouts involve a combination of large buildings and a series of higher number of smaller buildings that are located close-in to larger population centers, all of which fit really well for our portfolio,” said Olinger.

Moghadam noted the smaller-footprint buildings these types of tenants are favoring offer more options in terms of parcel size and have higher clear heights with more mezzanine floors, which effectively increases space utilization.

Of the 772 million square feet Prologis had within its portfolio as of March 31, 59% was U.S.-based and is expected to generate 77% of the REIT’s net operating income for the year. Prologis has about $97 billion in assets under management.

Some of the largest shippers and household-name companies lease from Prologis, with Amazon in first place contributing to 3.6% of its net effective rent. Amazon leases about 20.7 million square feet. Shippers DHL, UPS and FedEx, retailer Home Depot and automaker BMW all rank within Prologis’ top 10 largest customers. Retail giant Walmart is in 11th place with 4.4 million square feet. And the U.S. government ranks 19th, with just over 1 million square feet.

This year, Prologis expects to complete just under 12.4 million square feet of development activity for properties it will fully own and manage spending $1.1 billion to do so. Roughly half of that development is planned for the Western United States. For 2020 and beyond, so far it has docketed 1.6 million square feet in development solely in the West.

Of the $239 million Prologis spent on development starts globally in the first quarter, just 41.2% is build-to-suit, showing a bulk of speculative industrial work.

Despite recording a decline in net earnings in the first quarter, the REIT saw rental revenues jump year-over-year to $696.8 million compared to $555.9 million. Occupancy was roughly flat at 96.8%, but Prologis leased 43 million square feet in the first quarter, compared to 33 million the in the same quarter a year ago.

The results follow what Moghadam called Prologis’ “strongest year ever” in 2018. The REIT embarked on $3.1 billion in new developments globally totaling 36 million square feet. The year also saw Prologis sell off an 86-property portfolio to MapleTree and acquire Denver-based industrial REIT DCT Industrial.

Link to article: Prologis Sees Opportunity in Smaller Warehouse Footprints

For its 7th year in a row, Calco Commercial has been named as a top brokerage firm in San Francisco.

Calco Commercial leased and sold 1,112,761+/- square feet of industrial, flex, office and land in 2018 comprising 66 transactions. Calco Commercial is a leading full-service industrial & commercial real estate firm with decades of experience in Landlord /Owner representation, 1031-exchanges, property management and property valuations. Let us help make the most of your real estate properties and investments.