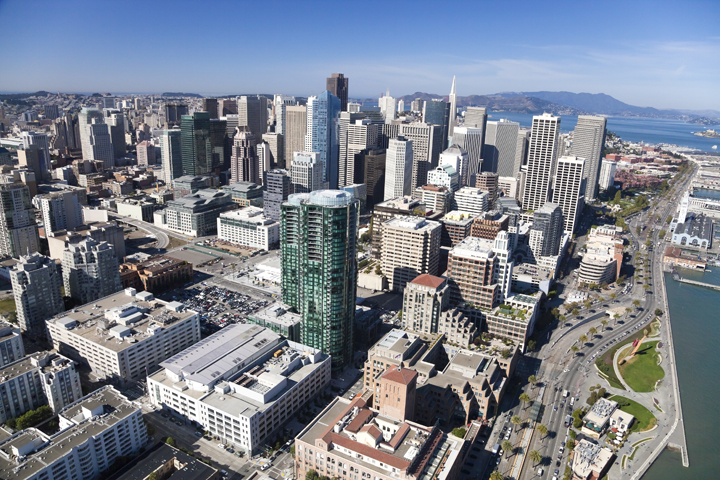
Vacancy Decreases to 2.7%; Rents Up 3.5%
Net absorption positive 359,380 SF in first quarter


click here to download the Q1 Report: Calco Q1 Market Report 2016

Vacancy Decreases to 2.7%; Rents Up 3.5%
Net absorption positive 359,380 SF in first quarter
click here to download the Q1 Report: Calco Q1 Market Report 2016
Source: San Francisco Business Times
By: Roland Li
Date Posted: May 2, 2016
Boston Properties, San Francisco’s largest office landlord, thinks the country’s hottest office market is cooling.
In an earnings call last week, Doug Linde, president of Boston Properties (NYSE: BXP), said that San Francisco’s office market is seeing fewer space needs from larger tenants, which could indicate a slowdown, while Silicon Valley’s activity is growing.
“I think the big difference between the market then — i.e. in 2014 and 2015 — and today is really the lack of large growth requirements, and by that I mean big tenants over 300,000 square feet,” said Linde, according to a transcript.
Boston Properties, which had 5.8 million square feet of office space in the Bay Area market at 93.8 percent occupancy as of December 2015, is working on some of the largest office projects in the city. Along with minority partner Hines, Boston is building Salesforce Tower, which will be the tallest tower in the city when it opens next spring. Still, Linde cited some pullback.
“San Francisco has slowed from the pace that it was going at in 2014 and 2015. Silicon Valley continues to be very active and actually has been expanding,” he said. There’s a dearth of huge tenants such as Salesforce.com, Stripe and LinkedIn, who all signed huge leases over the past three years, he added.
“So technology is still a vibrant part of the market, it’s still expanding, it’s not quite in the same manner that it was in 2014 and 2015,” said Linde.
Linde’s perspective mirrors the consensus of many real estate brokerages, who have projected a slowdown this year after record leasing activity in the past few years. However, the majority of first quarter reports anticipates that San Francisco will remain one of the country’s most expensive markets. Asking rents are over $70 per square foot, and vacancy is hovering around 5 percent for Class A space.
But some real estate professionals fear that a full downturn could occur. They see a tech bubble, citing startups with unsustainable business models that are committing to huge blocks of space that they likely won’t fill.
Boston Properties, though, says its developments are filling up. Salesforce Tower is now 59 percent occupied, said Linde on the earnings call, and the landlord is in talks with both single-floor and multi-floor tenants. He said that by the end of the second quarter, the company hopes to complete another 100,000 square feet in leases.
In the past quarter, Bain & Co. and Vy Capital have signed leases at Salesforce Tower, underscoring continued demand from non-tech tenants. CBRE Group Inc., the tower’s own broker, is also close to a lease. Boston Properties also completed 535 Mission St. in 2014 and is seeking approvals for a 1.1 million-square-foot project at Fourth and Harrison streets in the Central SoMa district.
However, Boston Properties has also shown caution. Michael Tymoff, Boston Properties’ senior project manager, development, told the Business Times in February that the company has declined to pursue projects because expected returns didn’t match land or construction pricing.
“We are very disciplined, both in our timing and the selectivity of sites,” he said. “While we evaluate every project on its own merits, we currently target 7 percent returns or better for our ground-up office developments.” Tymoff didn’t immediately respond to requests for additional comment on Monday.
Brokerage data also indicates that Linde’s comments on tenant demand may be inaccurate. JLL is tracking over 9.3 million square feet of current demand in San Francisco, including three tenants with requirements over 500,000 square feet.
Brokers have said that Google Inc. (NASDAQ: GOOG), as well as health care and financial services firms are seeking large blocks of space over 300,000 square feet. Amazon.com Inc. (NASDAQ:AMZN)’s Twitch and cloud-computing company Okta, and co-working firm WeWork are also looking for spaces larger than 100,000 square feet, according to multiple sources.
The slowdown this year is in part because the last three years have seen record activity, and the pipeline of new projects, including Salesforce Tower, have rents as high as the triple digits.
“A lot of the growth has already occurred,” said Amber Schiada, director of research for Northern California at brokerage JLL. “If you’re a big company like that, you’re not eager to take on $80 rents or $100 rents.”
There’s also more scrutiny for rising costs. “VCs are really pulling back on expansion on their younger companies, trying to minimize burn rates,” said Schiada, referring to venture capitalists.
New towers in the Transbay district including 181 Fremont St. and Park Tower have signed no tenants, but those buildings also won’t be delivered until late next year or later, said Schiada. Tenants are showing a preference for pre-built space that is ready for occupancy, she said.
Another big public landlord, Kilroy Realty Corp. ( NYSE: KRC), stated last week during its earnings call that San Francisco remained strong, and sublease space was being filled up.
Mike Sanford, Kilroy’s executive vice president of Northern California, said that the company was still seeing strong demand. “Down on the street there’s just more activity, more tenants coming to the buildings, looking for space and then boots on the ground,” said Sanford.
Link to article: Office Slowdown
Most Markets Continue to Enjoy Steady Growth in Demand and Rental Rates, Although Rate of Increases Beginning to Moderate
Source: CoStar News
By: Randyl Drummer
Date Posted: April 21, 2016
The U.S. office market appears to be at the stage in the real estate cycle that analysts often describe as a turning point or tipping point. Overall, the U.S. office market continued to post solid fundamentals during the first quarter, including very strong net absorption, while traces of a slowdown in demand appeared in some markets.

“We are seeing mixed signals in the marketplace, although our expectation is the office market will continue to do fairly well for the next few years,” said CoStar Director of Office Research Walter Page, who presented the First Quarter 2016 State of the U.S. Office Market Review and Forecast findings to CoStar subscribers this week. “The biggest mixed signals are really related to net absorption and sales volumes.”
Total net absorption of 11 million square feet of office space in the first quarter was about the same as first-quarter 2015, a leveling off from the upward trend of recent quarters. On the other hand, net space taken by occupiers over the past four quarters exceeds the similar trailing period ending in 2015’s first quarter by nearly 11% at 98 million square feet, noted Page, who presented the findings this week, along with Hans Nordby, managing director of CoStar Portfolio Strategy, and Aaron Jodka, senior manager, Market Analytics.
“All in all, it’s still a very good picture, but the market is clearly not growing as rapidly as before,” added Page. “Our expectation is that going forward, we’re going to see a continuing decline in net absorption, principally because we’re headed for that demographic cliff of retiring baby boomers.”
Office-using employment, a key metric for office demand, continued to outperform the broader job market, especially in the nation’s tech markets, as well as South Florida, Dallas and other pockets of growth and recovery from the housing bust following the Great Recession. Conditions for office job growth should remain strong for the next two years before gradually slowing through 2020, Nordby said.
Despite signs of slowing, solid absorption and occupancy levels continue to be enabled by the moderate pace of new office construction and deliveries in most markets. The 127 million square feet of office space under construction in the first quarter was up only slightly from the same period last year.
Link to article: Office Market Mixed Signals
San Francisco’s Office Vacancy Decreases to 6.8%
The San Francisco Office market ended the first quarter 2016 with a vacancy rate of 6.8%. The vacancy rate was down over the previous quarter, with net absorption totaling positive 887,196 square feet in the first quarter. Vacant sublease space increased in the quarter, ending the quarter at 1,412,643 square feet. Rental rates ended the first quarter at $52.43, an increase over the previous quarter. A total of two buildings delivered to the market in the quarter totaling 480,000 square feet, with 5,352,288 square feet still under construction at the end of the quarter.
Absorption
Net absorption for the overall San Francisco office market was positive 887,196 square feet in the first quarter 2016. That compares to positive 680,988 square feet in the fourth quarter
2015, negative (297,950) square feet in the third quarter 2015, and positive 1,332,620 square feet in the second quarter 2015.
The Class-A office market recorded net absorption of positive 669,332 square feet in the first quarter 2016, compared to positive 689,681 square feet in the fourth quarter 2015, negative (25,939) in the third quarter 2015, and positive 825,531 in the second quarter 2015.
The Class-B office market recorded net absorption of positive 248,697 square feet in the first quarter 2016, com- pared to negative (39,232) square feet in the fourth quarter
2015, negative (216,768) in the third quarter 2015, and positive 555,278 in the second quarter 2015.
The Class-C office market recorded net absorption of negative (30,833) square feet in the first quarter 2016 com- pared to positive 30,539 square feet in the fourth quarter
2015, negative (55,243) in the third quarter 2015, and negative (48,189) in the second quarter 2015.
Net absorption for San Francisco’s central business district was positive 660,981 square feet in the first quarter 2016. That compares to positive 163,176 square feet in the fourth quarter
2015, negative (267,529) in the third quarter 2015, and positive 387,476 in the second quarter 2015.
Net absorption for the suburban markets was positive 226,215 square feet in the first quarter 2016. That compares to positive 517,812 square feet in fourth quarter 2015, negative (30,421) in the third quarter 2015, and positive 945,144 in the second quarter 2015.
Vacancy
The office vacancy rate in the San Francisco market area decreased to 6.8% at the end of the first quarter 2016. The vacancy rate was 7.0% at the end of the fourth quarter 2015,
6.6% at the end of the third quarter 2015, and 6.4% at the end of the second quarter 2015.

Class-A projects reported a vacancy rate of 7.7% at the end of the first quarter 2016, 8.0% at the end of the fourth quarter 2015, remained the same at 7.4% at the end of the third quarter 2015 compared to the previous quarter.
Class-B projects reported a vacancy rate of 6.7% at the end of the first quarter 2016, 7.1% at the end of the fourth quarter 2015, 6.7% at the end of the third quarter 2015, and
6.3% at the end of the second quarter 2015.
Class-C projects reported a vacancy rate of 3.8% at the end of the first quarter 2016, 3.7% at the end of fourth quarter 2015, 3.9% at the end of the third quarter 2015, and 3.6% at the end of the second quarter 2015.
The overall vacancy rate in San Francisco’s central business district at the end of the first quarter 2016 decreased to 6.3%. The vacancy rate was 7.0% at the end of the fourth quarter 2015, 6.0% at the end of the third quarter 2015, and 5.8% at the end of the second quarter 2015.
The vacancy rate in the suburban markets increased to 7.5% in the first quarter 2016. The vacancy rate was 7.1% at the end of the fourth quarter 2015, 7.5% at the end of the third quarter 2015, and 7.4% at the end of the second quarter 2015.
Sublease Vacancy
The amount of vacant sublease space in the San Francisco market increased to 1,412,643 square feet by the end of the first quarter 2016, from 1,352,132 square feet at the end of the fourth quarter 2015. There was 1,275,923 square feet vacant at the end of the third quarter 2015 and 1,102,001 square feet at the end of the second quarter 2015.
San Francisco’s Class-A projects reported vacant sublease space of 998,469 square feet at the end of first quarter 2016, up from the 967,996 square feet reported at the end of the fourth quarter 2015. There were 857,982 square feet of sub- lease space vacant at the end of the third quarter 2015, and 748,203 square feet at the end of the second quarter 2015.
Class-B projects reported vacant sublease space of 333,325 square feet at the end of the first quarter 2016, up from the 329,958 square feet reported at the end of the fourth quarter 2015. At the end of the third quarter 2015 there were 342,020 square feet, and at the end of the second quarter 2015 there were 298,324 square feet vacant.
Class-C projects reported increased vacant sublease space from the fourth quarter 2015 to the first quarter 2016. Sublease vacancy went from 54,178 square feet to 80,849 square feet during that time. There was 75,921 square feet at the end of the third quarter 2015, and 55,474 square feet at the end of the second quarter 2015.
Sublease vacancy in San Francisco’s central business district stood at 673,271 square feet at the end of the first quarter 2016. It was 595,812 square feet at the end of the fourth quar- ter 2015, 543,796 square feet at the end of the third quarter 2015, and 491,777 square feet at the end of the second quarter 2015.
Sublease vacancy in the suburban markets ended the first quarter 2016 at 739,372 square feet. At the end of the fourth quarter 2015 sublease vacancy was 756,320 square feet, was 732,127 square feet at the end of the third quarter 2015, and was 610,224 square feet at the end of the second quarter
2015.
Rental Rates
The average quoted asking rental rate for available office space, all classes, was $52.43 per square foot per year at the end of the first quarter 2016 in the San Francisco market area. This represented a 1.1% increase in quoted rental rates from the end of the fourth quarter 2015, when rents were reported at
$51.84 per square foot.
The average quoted rate within the Class-A sector was $54.11 at the end of the first quarter 2016, while Class-B rates stood at $51.77, and Class-C rates at $46.73. At the end of the fourth quarter 2015, Class-A rates were $53.77 per square foot, Class-B rates were $50.94, and Class-C rates were $45.57.
The average quoted asking rental rate in San Francisco’s CBD was $57.99 at the end of the first quarter 2016, and $50.36 in the suburban markets. In the fourth quarter 2015, quoted rates were $58.19 in the CBD and $49.47 in the suburbs.
Inventory
Total office inventory in the San Francisco market area amounted to 165,448,464 square feet in 3,843 buildings as of the end of the first quarter 2016. The Class-A office sector consisted of 77,319,980 square feet in 304 projects. There were 1,437 Class-B buildings totaling 64,146,043 square feet, and the Class-C sector consisted of 23,982,441 square feet in 2,102 buildings. Within the Office market there were 209 owner- occupied buildings accounting for 18,858,040 square feet of office space.
Sales Activity
Tallying office building sales of 15,000 square feet or larger, San Francisco office sales figures fell during the fourth quarter 2015 in terms of dollar volume compared to the third quarter of 2015.
In the fourth quarter, 14 office transactions closed with a total volume of $1,043,890,500. The 14 buildings totaled 1,634,104 square feet and the average price per square foot equated to $638.82 per square foot. That compares to 13 transactions totaling $1,955,263,000 in the third quarter 2015. The total square footage in the third quarter was 2,904,410 square feet for an average price per square foot of $673.20.
Total office building sales activity in 2015 was down com- pared to 2014. In the twelve months of 2015, the market saw 48 office sales transactions with a total volume of $4,814,873,500. The price per square foot averaged $651.62. In the same twelve months of 2014, the market posted 76 transactions with a total volume of $6,456,094,000. The price per square foot averaged
$544.50.
Cap rates have been lower in 2015, averaging 4.76% compared to the same period in 2014 when they averaged 4.88%. One of the largest transactions that occurred within the last four quarters in the San Francisco market is the sale of 333 Bush St in San Francisco. This 546,182-square-foot office building sold for $378,500,000, or $692.99 per square foot. The property sold on 12/24/2015, at a 3.70% cap rate.
source: CoStar 1st Quarter 2016 San Francisco Office Market Report
Source: CoStar News
By: Mark Heschmeyer
Dated Posted: April 11, 2016
Investing in high-vacancy office properties has always involved a lot of risk. That is no more true than in today’s market as more companies adopt more-efficient floorplans that allocate fewer square feet per employee.
However, recent research by Andrew Rybczynski and Suzanne Mulvee of CoStar Portfolio Strategy found that investors who did brave the odds and acquired high-vacancy office properties in this economic-recovery cycle have enjoyed superb returns. In general, value gains from acquiring low-occupancy office property, leasing it up, and selling have averaged 33% during this cycle versus just 20% in average value gains for the same strategy during the last one.
The research also found that office property in central business districts (CBDs) generated slightly more of these gains than suburban assets, as office users have shown a stronger preference for urban over suburban locations up to this point in the cycle.
The CoStar Portfolio Strategy team examined 44 million square feet of office buildings that sold after successfully executing an occupancy turnaround over the past 12 years. These turnaround buildings were defined as those that were initially acquired with occupancies below 70% and then resold one to four years following the initial sale with an occupancy improvement of at least 25 percentage points. The office buildings had to be 10,000 square feet or larger with an initial sale price of $5 million or more.

“The decline in cap rates has certainly provided more of a tailwind for office property values this cycle than was the case for the last one,” Rybczynski noted. “However, the outsized value gains realized more likely reflect the greater volatility in rent during this cycle, especially in urban areas. We observed that non-CBD submarkets in recent years have narrowed the gap in delivering appreciation returns, which suggests a better risk discount for non-CBD properties than previously available.”

Despite strong demand for core assets and the better price appreciation, the sales volume of successful turnarounds of office buildings with high vacancy has not reached the levels achieved at the peak of the last cycle (see Chart 2 above.) Although it appears more investors are targeting value-add properties today, Mulvee pointed out that more of these opportunistic investors appear to be holding their properties longer.
“While sales of office properties with sub-70% occupancies has been 33% higher over the past three years than in the comparable period of the last cycle, fewer of these assets have re-traded. It seems that these value-add investors are holding their positions longer, looking to increase occupancy and rent to maximize operating cash flows before eventually selling to achieve their return targets,” Mulvee said.
However, the window for successfully executing such a strategy may be closing. According to the CoStar Portfolio Strategy analysts, rent gains are expected slow this year for office space as new supply ramps up. As that happens, any additional reward for holding onto assets may not outweigh the heightened risk posed by new supply.
Link to article: Value Gains
Source: The Registry
By: David Goll
Date Posted: March 30, 2016
While some San Francisco real estate observers worry a sizable increase in office space available for sublease may signify a potential property “tech wreck” in the works, others view an increasing amount of available space as more of a corrective adjustment that’s creating some benefit.
According to a report from Cushman & Wakefield, the amount of office space being subleased in San Francisco, including the Financial District and SOMA, jumped from 1.3 million square feet in the third quarter of 2015 to nearly 1.7 million square feet in the fourth quarter. By the end of February, that number had climbed to 1.9 million square feet. As of March 21, 2016, JLL reports that this type of sublease availability has climbed to 2.28 million square feet in San Francisco.
About half of the space available for sublease is coming from technology companies, according to the JLL and Cushman & Wakefield reports. That translates to 45 of the 138 subleases in San Francisco, or close to 1.1 million square feet. And while 41 percent of companies gave contracting or consolidation as their reasons for subleasing space, 26 percent cited relocation inside the San Francisco city limits, while 22 percent are moving all or part of their businesses out of the city, according to Cushman.
“We saw the trend begin to intensify in the fourth quarter [of 2015],” said Christina Clark, senior vice president in the San Francisco office of Cresa Corporate Real Estate. “Our clients were starting to evaluate whether they were occupying too much space, what would be the best way to handle and utilize it. Others are wondering if the high costs are going to continue and whether it was worth getting into a seven-year agreement with unfavorable terms.”
As a result, Clark said leasing activity began to slow as companies “pushed the pause button.”
“We have been monitoring this trend since the second quarter of 2015,” said Andrew Nicholls, advisor in Cresa’s San Francisco office. “That’s when we noticed a distinct shift in the market.”
Colin Yasukochi, director of research and analysis in the San Francisco office of CBRE Group, the Los Angeles-based commercial real estate firm, said the subleasing trend became especially notable late last year, coming mainly from the tech sector. The reasons are varied.
“Some are expanding into new offices here in San Francisco, while some just have excess space they don’t need right now,” Yasukochi said. “There’s a variety of reasons. And what we are seeing, especially with high-quality subleased space, is that it’s not staying on the market that long. It frequently is leased within three to six months.”
Yasukochi said he doesn’t regard the current inventory of subleased space—which covers all grades of office space, but mostly A and B—to be an excessive amount.
“If there was, you would see much bigger discounts offered on space being leased directly from landlords, like 30 or 40 percent,” he said. “When the market is healthy, the discounts are not that large. Subleased space is increasing, but we’re not seeing large discounts.”
According to his research, Yasukochi said the amount of subleased space in downtown San Francisco has jumped from 1.1 million square feet in October to 1.7 million square feet in March. Unlike other observers, who predict that figure will grow substantially by year’s end, he is not quite as certain of that outcome.
“It could grow, but this is an evolving situation and that has yet to be determined,” Yasukochi said. “We will see if the supply continues to exceed demand.”
JLL’s figures tell a similar story today. Five of the largest eight sublease spaces are already in some form of discussions for the space to be subleased. Those top five available spaces are Charles Schwab’s 305,502 square feet at 215 Fremont, Dropbox’s two spaces at 185 Berry for a total of 212,000 square feet, Bingham McCutchen’s 98,000 square feet at 3 Embarcadero Center and Yahoo’s 60,000 square feet at 343 Sansome, which was just subleased to Airwave, a drone software platform company. If all these negotiations result in a new tenant, that would drop the available space to 1.6 million square feet, a 30 percent drop from where we are today. One thing to note, however, according to JLL’s report, is that 43 of the 138 available spaces came to the market in the last month, a 45 percent jump in absolute number of spaces. Some of this space includes nearly 25,000 square feet from Medium at 760 Market, nearly 34,000 square feet from Zenefits at 303 2nd Street, 18,000 square feet from Riverbed at 680 Folsom and 11,000 square feet from Box at 100 1st Street.
Asking lease rates for Class A office space downtown being offered directly from landlords averages about $76 per square foot annually, a figure which grew 14 percent in the fourth quarter of 2015, Yasukochi said. Though it would depend on the condition of the space being subleased by another tenant, asking lease rates would likely be about $65 per square foot annually this spring, he added.
“If it’s in good shape and there’s lots of interest in it,” Yasukochi said of space at those rent levels, which are reflective of the 10 to 15 percent discounts being offered.
Drew Arvay, senior vice president in the San Jose office of Cushman & Wakefield, said he’s aware of the glut of space available for sublease in San Francisco, but said it’s a different dynamic in Silicon Valley—or cities in Santa Clara, San Mateo and southern Alameda counties. It even goes by a different name.
“We call it shadow space,” Arvay said. “There are instances where companies are seeking to sublease space, but it often is on a short-term basis.”
On the other hand, Arvay said some of the Valley’s largest tech giants that occupy millions of square feet of office space might keep a few hundred thousand square feet empty for anything from storage to future productive use when they expand operations again.
“How companies are using space has really shifted in recent years,” he said. “We went from private offices and hallways to cubicles. The cubicles started out averaging 250 to 275 square feet of space per person, but then shrunk to 160 square feet. Now, cubes are disappearing and being replaced with even smaller work pods or benches, or shared space.”
But Silicon Valley companies are offsetting the downsized workplace trend by continuing to hire employees by the thousands, so they are reluctant to shrink their office footprints too substantially. Arvay said Gensler, the San Francisco-based architecture, design and planning firm, has dubbed Silicon Valley companies as the most efficient users of work space.
“That’s not to say we are immune from having surplus space that could be available for subleasing, but this is still a different situation from downtown San Francisco,” he said.
He added there is another dynamic at work in Silicon Valley and elsewhere in the corporate world over the past three years since Yahoo Inc. CEO Marissa Mayer famously ended her company’s popular work-from-home policy for employees.
“Employers have discovered innovation is born of collaboration, of employees talking to one another during the work day, talking over lunch,” Arvay said. “The money they used to save on renting space by having employees work in their pajamas from home was being lost by a decrease in developing innovative ideas.”
Both Clark and Yasukochi said they see another potential storm cloud on the horizon for San Francisco employers: the possible decrease in VC funding, mainly affecting the tech sector.
“We are hearing that while companies are still getting funded, some are getting less funding or having trouble getting another round of funding,” Clark said. “VC funding is critical, so we are watching that very closely. That trend really started accelerating in the fourth quarter, making tenants seriously consider whether they need so much space.”
Link to article: Sublease Conundrum
Google’s Medical Technology Division, Verily, Subleases Large Office Campus in South San Francisco
Source: CoStar
By: Steve Wells
Date Posted: March 9, 2016
Verily, formerly called Google Life Sciences, has subleased 407,000 square feet from Amgen to establish a separate headquarters in South San Francisco for the new Google division, which is gearing up to provide pioneering technology for medical research and devices.
Verily will occupy the former Onyx Pharmaceuticals office campus consisting of three Class A office buildings located at 249, 259, and 269 E. Grand Ave.

The planned move 30 miles north from Google’s Mountain View, CA, headquarters, will place the new firm within a global hub for the biotech industry. It also takes a big chunk of the nearly 700,000 square feet of excess space Amgen Inc. (NASDAQ: AMGN) is seeking to sublet in the area. Amgen closed its Onyx Pharmaceuticals subsidiary last year after acquiring the cancer drug developer in 2013 for $9.7 billion.
Alexandria Real Estate Equities, Inc., (NYSE: ARE), a real estate investment trust that focuses on science and technology campuses in urban locations, owns the three buildings. The recently developed campus also has two land parcels representing nearly 400,000 square feet of potential expansion space.
An initial 400 Verily employees are expected to relocate to the new campus by the end of this year with the expectation that the total number at the location could grow to as many as 1,000 through future expansions.
“We are honored that Verily has chosen to expand into one of Alexandria’s world-class collaborative science and technology campuses,” said Stephen A. Richardson, chief operating officer and San Francisco regional market director of Alexandria. “Through our long-term relationship with Google, which dates back to 1998, we have been able to provide Verily with highly curated, innovative and integrated campus solution, which will help support its mission to use technology to better understand health, as well as prevent, detect and manage disease.”
Source: San Francisco Business Times
By: Roland Li
Date Posted: March 3, 2016
Quantcast, a website analytics company, has leased three floors totaling about 95,000 square feet at 795 Folsom St., the former Twitter Inc. headquarters in South of Market, said two sources familiar with the property.

San Francisco-based Quantcast is replacing AT&T Inc. (NYSE: T), which vacated the space at the end of January, said a source. The swiftness of the deal is another sign that large chunks of office space are still being filled rapidly throughout the city, despite recent job cutbacks at prominent startups such as Zenefits and Surveymonkey. The asking rent in the building was in the mid-$70s, according to marketing materials.
Quantcast, founded in 2006, is also more established than many of the venture capital-fueled tech tenants that are growing rapidly. Quantcast was the 33rd-largest tech employer in the city with 385 employees as of January, up slightly from its 368 local employees in January 2015, according to Business Times research.
A Quantcast spokeswoman confirmed the lease and said the company will be relocating from its current headquarters about three blocks away at 201 Third St.
Steve Anderson and Bryan Ivie of JLL represented landlord ASB Real Estate Investments and asset manager Union Property Capital in the lease. JLL also represented the tenant. JLL declined to comment.
The six-story, 187,000-square-foot building at 795 Folsom St. is close to Yuerba Buena and Moscone Center. It was built in 1976 and renovated in 1999.
Twitter (NYSE: TWTR) moved into 795 Folsom St. in 2009, and then relocated to its current headquarters at 1355 Market St. in 2012. Current tenants at 795 Folsom St. include the real estate space provider Regus (LON: RGU) and gaming company Kabam Inc.
ASB bought 795 Folsom St. from Cornerstone Real Estate investors for $110 million in 2013.
Link to article: SF Tech Company Leases Three Floors at former Twitter HQ
Bowling for biotech-or how real estate is changing to meet tight space, labor markets
Source: San Francisco Business Times:
By: Ron Leuty
Date Posted: February 4, 2016
Biotech real estate developers are rolling with the times, designing space for young, cash-flush companies desperate to hold on to talented employees who want more than a bench and a place to hang their lab coats.
Take HCP Inc., which is breaking ground on the second phase of its massive Cove at Oyster Point development in the sterile-and-scrubbed heart of the life sciences industry in South San Francisco. Along with two lab and office structures totaling 230,000 square feet, HCP’s next stage of the potential 884,000-square-foot project includes 20,000 square feet of retail, attempting to fill a desperate need among the thousands of biotech workers.

The first two-building phase, which will open in the third quarter, includes a marketplace-like food area on the ground floor as well as pool tables, table tennis and a two-lane bowling alley.
Yes, a bowling alley.
“It’s really taking an urban-type downtown environment and bringing it to a suburban market,” said HCP Executive Vice President Jon Bergschneider. “It’s large space for people to break out and team build.”
In the tech industry, such “amenity space” is commonplace in the tug-of-war to keep and attract fresh, young talent. Yet despite occasional events at individual companies — South San Francisco-based biotech granddaddy Genentech Inc. is well known for its bi-monthly “Ho-Hos” get-togethers — biotech has mostly maintained a buttoned-down focus on its benches and beakers.
Yet biotech executives and the developers who build space for their companies say that is changing. Employees can be in their labs at any time of the day or night, and the east side of Highway 101 in South San Francisco is largely a food and entertainment desert, so they often jump in their cars at break time. But the growing millennial workforce is different, they say, wanting services within walking distance.
BioMed Realty Trust, recently bought by Blackstone Group LP (NYSE: BX), is building out amenity space at a potential 595,000-square-foot campus in Foster City for Illumina Inc. (NASDAQ: ILMN). Across Oyster Point Boulevard from The Cove, BioMed has drawn up plans for similar amenities space at its Gateway of Pacific towers, which is entitled for 1 million square feet.
Companies are paying up for the space, too, in a tight real estate market. The first two tenants in the 250,000-square-foot first phase of The Cove — newly public cancer drug developer CytomX Therapeutics Inc. (NASDAQ: CTMX) and Denali Therapeutics Inc., which scored the largest startup round of venture capital for its focus on neurodegenerative diseases — will pay in the mid- to upper-$50 range after they move in the third quarter.
And for the next couple of years, The Cove and Phase 3 Real Estate Partners Inc., which last year bought the Centennial Towers project on the west side of Highway 101 and rebranded it Genesis-South San Francisco, are the main new, multiple-tenant life sciences spaces on the market.
As a result, said Rick Friday, a senior vice president at real estate brokerage CBRE Inc., the biotech real estate market remains tight. The brokerage is tracking about 1.6 million square feet of demand along the Peninsula, said Chris Jacobs, executive vice president of life sciences at CBRE.
“Ten years ago, a lot of companies could think two, three years in advance,” Friday said. “Now when companies decide they need space, they need it in 12 months or less.”
One of the first two buildings in The Cove remains unleased; the two-building second phase includes retail and a four-story parking garage — another sign of the times as developments have become denser with less surface parking.
Instead of parking, when the entire project is built out, The Cove will include a 5.5-acre open area with bocce ball, basketball and volleyball courts and a picnic area, said Scott Bohn, an HCP vice president.
The demand for The Cove’s first phase gave HCP confidence to start the second stage on time. What’s more, it helped them shape the footplates of the second phase, making them slightly smaller and more flexible for a wider variety of potential tenants, Jacobs said.
“The amenities center has really resonated as well,” Jacobs said. “Everybody we sit and talk to says, ‘It’s about time.'”
Link to article: Cove-Amenity Space
Source: CoStar
By: Randyl Drummer
Date Posted: January 28, 2016
For almost everyone involved in commercial real estate, 2015 was a very good year. The impressive recovery in commercial property values is apparent in the year-end release of the CoStar Commercial Repeat-Sale Indices (CCRSI), which delineate the broad price gains across property types and regions amidst record investment transaction volume in 2015.
Both the value-weighted and the equal-weighted segments of CCRSI’s U.S. Composite Index, which constitute the two broadest measures of aggregate commercial property pricing, continued to gain ground in December, the fourth quarter and for the year. Demand for core property assets was especially strong, with the value-weighted index rising 12.6% during 2015 to an all-time high of 19.1% above its pre-recession peak.


December transaction activity remained true to its seasonal pattern observed over the last several years, spiking in the final month of the year as investors raced to close transactions prior to year-end. The December composite pair volume of nearly $18 billion was the highest monthly total on record, helping lift total 2015 volume to $128.3 billion, a 26.2% increase from the previous peak reached in 2014.

While pricing in core U.S. markets set records in 2015, investors moving out on the risk spectrum in search of higher yields resulted in equally strong sales activity in non-core markets and property types, as reflected in the equal-weighted U.S. Composite index. Heavily influenced by lower-value properties typical of those in secondary and tertiary markets, the equal-weighted U.S. Composite Index rose 12.6% in 2015 and is now within 3.4% of its previous high water mark.
The investment-grade segment of the CCRSI equal-weighted index, capturing the performance of high-quality properties, moved to within 1% of its prior peak, while the general commercial index of smaller, lesser-quality assets remains 4.6% off its previous high water mark, according to CCRSI.
Quarterly indices for all six major property types, including the land and hospitality properties, posted double-digit gains in 2015, as did each of the four U.S. regional indices, marking the second straight year in which all the indices increased at a rate of 10% or above.

The Northeast Multifamily Index was the best-performing regional property segment of 2015, rising 15.4% to end the year 44% above its 2007 high. The West Multifamily and West Office Indices also posted exceptionally strong growth of 14.8% and 13.9%, respectively, nudging the overall West Regional Index to within 1% of its pre-recession peak. The South and Midwest indices advanced by 12% and 10%, respectively, though both remained 10% or more below their prior high levels.


The latest quarterly data further confirmed the steady pricing gains across all six property types. The CCRSI Prime Markets Indices increased more rapidly than the broader property-type indices in 2015, suggesting that core markets remained attractive even though investors showed an increased tolerance for risk in second- and third-tier markets as market fundamentals continue to improve.
By far, the U.S. Multifamily Index showed the strongest annual rate of increase, and it remains the only U.S. property index to have surpassed its pre-recession peak, ending the year 18.8% above its 2007 high.
In particular, the Prime Multifamily Metros Index, which passed its previous peak back in June 2013, skyrocketed in 2015 to 41.4% above 2007 levels. Multifamily fundamentals remained healthy in 2015 despite unprecedented levels of new construction, with continued price appreciation even as nationwide vacancy rates held below 4% in the fourth quarter of 2015.
Link to article: CRE Soars in 2015
Full Composite Price Indices Report for CRE: January 2016 CCRSI Release