Category: commercial real estate san francisco (65)

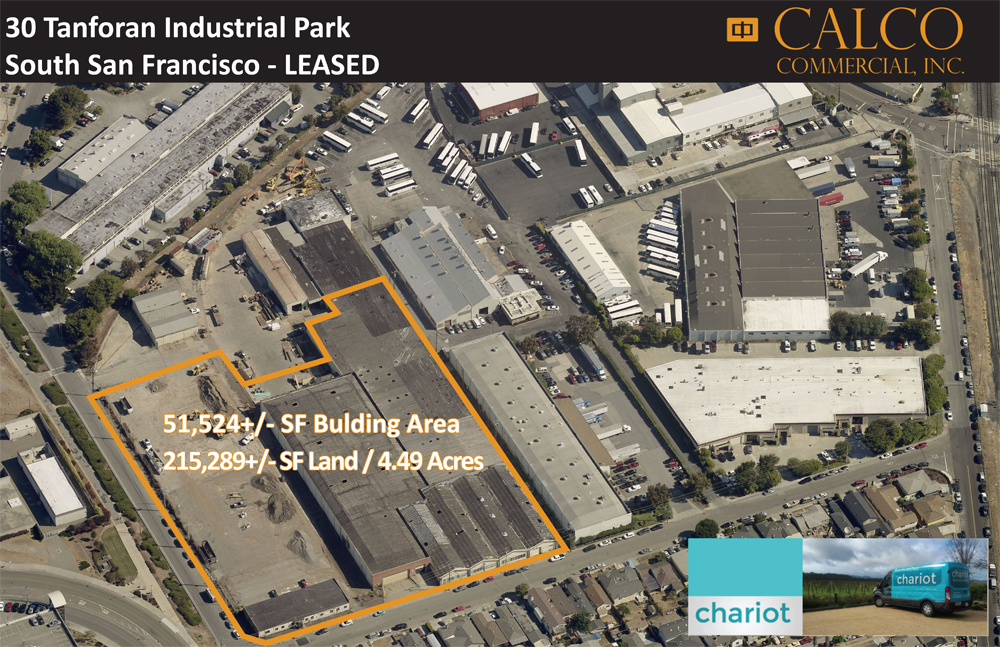
Calco Commercial recently completed a lease transaction at the 30 Tanforan Industrial Park in South San Francisco. Calco represented the Chariot, the Tenant, who will be occupying 51,524+/- square feet of building area and a total of 215,289+/- square feet (4.49 acres) of land. Chariot, a division of Ford Smart Mobility, is focused on transit solution by providing transportation options for commuters, enterprises and charters. Chariot operates across the Bay Area and is now offered in cities ranging from Austin to London.

The boom of e-commerce, fueled by Amazon, as created a demand for industrial warehouse space across the nation. But how long can the industrial boom be sustained–can other companies follow the “same day delivery” demands sparked by Amazon, and how will increasing construction costs affect the market? At Bisnow’s National Industrial event in New York, such questions were discussed.

Click here to read the responses including how a lack of truck drivers, old ports, and lack of space may impact the industrial marketplace: Industrial Boom

San Francisco Commercial Real Estate News:

Investors continue to pay record-setting prices to acquire San Francisco commercial buildings. The San Francisco Business Times reported earlier this week that One Front Street has sold for $521 million, equating to $800 per square foot.

one-front-2

Meanwhile, according to The Registry, 55 Hawthorne is slated to hit the San Francisco commercial market. The 143,000+/- square foot building is expected to earn $120-$125 million.

55-hawthorne-use

And in industrial news, the San Francisco investing continues–The Potrero Power Plant site is reportedly under contract between Associate Capital & NRG Engery. The San Francisco Business Times has reported that Associate Capital sees the industrial, but waterfront, property as “an unprecedented opportunity for infill development.”

power-plant2

San Francisco Tech CRE News:

As the Mission Bay Area continues to attract new tenants, start-ups and tech elites like UBER, a pillar in the tech world is also considering new digs south of the Bay Bridge: ADOBE. According to the San Francisco Business Times, Adobe Systems is eyeing 200,000+/- square feet in the 100 Hooper development–although no paper has been inked to date.

100-hooper

National CRE News:

And across the Atlantic, an investment fund has been created to target US multifamily properties. CoStar News has reported that Hansalnvest, based in Germany, has created a $500 million fund to invest in US Apartments. On the East Coast, Acadia Realty (based in New York) has created a $520 million fund targeting value-add retail investments, while San Francisco based Farallon Capital Management has raised $400 million to invest in commercial properties across the nation.

New Owner of high-profile Peninsula Tower aims to take biotech to new heights

Source: San Francisco Business Times
By: Ron Leuty
Date Posted: November 19, 2015

Emerging biotech companies are fighting a losing battle for space against deep-pocketed, aggressive tech companies. But Neil Fox expects to deliver a new life sciences option by this time next year.

Fox’s Phase 3 Properties Inc. closed Tuesday on its acquisition of the high-profile Centennial Towers project, nestled between San Bruno Mountain and Highway 101 in South San Francisco.

The developer plans to immediately convert part of the existing 12-story tower for biotech companies by the third quarter of 2016, then start construction of a 21-story, 400,000-square-foot biotech-centric structure to the immediate north that would come online in the second half of 2017.

centennial tower

The overall 800,000-square-foot development’s sale price wasn’t disclosed.

In a tight market for biotech labs/offices, Fox believes Phase 3’s focus on ready-to-occupy highrise space will be a winner. The vacancy rate for new biotech space in South San Francisco is in the low single digits, not counting a half-million square feet of sublease space held by Amgen Inc. (NASDAQ: AMGN).

If nothing else, Phase 3’s timing is impeccable: Space in the two-building, 253,000-square-foot first phase of HCP Inc.’s (NYSE: HCP) The Cove at Oyster Point already is booked for its third-quarter 2016 opening.

By the time, Phase 3’s 150,000-square-foot south tower upgrades for biotech will be ready, Fox said, and construction will be under way on the north tower.

Two other South San Francisco biotech projects entitled for roughly 3 million square feet — BioMed Realty Trust’s (NYSE: BMR) Gateway of Pacific and Shorenstein/SKS Properties’ bayside project — haven’t yet broken ground.

Centennial Towers developer Jack Myers earlier this year considered building the planned north tower as condominiums. But Fox, whose San Diego company focuses exclusively on life sciences, said the future is in biotech.

“Our research says there’s a need across the board. That’s why QB3’s incubators (in San Francisco and Berkeley) are so full,” Fox said. “There’s no real second-generation space on the market right now.”

Indeed, a number of young and emerging life sciences companies — as well as larger, growing companies — are in a critical search for space.

Buoyed by a renewed interest by venture capital firms in early-stage drugs, those companies are bringing on more staff to push experimental treatments into studies in humans, but they often lose the space race to larger, established tech or drug-development companies that can lease floors at a time.

“We need the space last month, not a year from now,” said Ken Horne, CEO of Symic Biomedical Inc., a 17-person, two-year-old company with one potential treatment in an early-stage clinical treatment and another set to start in the first half of next year. “A year is hard for a high-growth, high-momentum startup.”

Symic is housed in the University of California-related QB3@953 life sciences incubator in San Francisco’s Dogpatch neighborhood.

But Fox’s excitement about Centennial Towers isn’t based on timing alone: The development will offer biotech companies a high-rise option they don’t otherwise have in the Bay Area, he said, as well as space that needs a minimum of work for a quick move-in.

The Cove from HCP and the Gateway of Pacific project from BioMed, which is being acquired by Blackstone Group, have played up their tech-like campuses and amenities such as a bocce ball court and walking trails. But Fox said Phase 3’s differentiator with Centennial Towers is the high rise option that rarely is offered biotech companies outside of high-cost, high-density markets such as New York and Boston.

Working with San Diego’s McFarlane Architects, Phase 3 has floor plans that Fox said work for 95 percent of biotech companies. The space is a mix of 60 percent office and 40 percent general biology and chemistry labs — all with natural light.

Skidmore, Owings & Merrill LLP, the architect for Centennial Towers’ unique glass-facade south structure, also is designing the north tower.

“There’s no buried space in our buildings,” Fox said. “The quality of the project, the detail that went into it (by Myers), was something that was very attractive to us.”

Link to article: Peninsula Biotech

The San Francisco Business times is reporting that Dropbox is slated to release 200,000 square feet of its current 500,000 square feet of office located at 185 Berry Street in China Basin (Dropbox looks to Shed China Basin HQ Space) at $75 a square foot. However, the article suggests that the shedding of space by Dropbox may be more about not wanting to “stay around one location” rather than a sign of a market slowdown.

As other large tech establishments and unicorns (Salesforce, Rocketfuel, Twitter, Lyft, etc.) have either put space up for sublease or plan to shift operations to other locations, market analysts are keeping watch, and some venture capitalists are growing worried (Winder is Coming). But as the Business Times’ article also points out, the availability of sublease space helps other companies who are going the ability to break into the market, or allow “…the likes of Apple to dive into San Francisco in a spaced leased by CNET” In a related article on SF Curbed (Dropbox Sheds), Mary Jo Bowling reports that “real estate pros are still reporting a healthy demand for SF commercial space, albeit with some caution.”

185 berry
(185 Berry Street)

San Francisco’s Vacancy Increases to 3.6%
Net Absorption Negative (517,362) SF in the Quarter

Source: CoStar

The San Francisco Industrial market ended the third quar- ter 2015 with a vacancy rate of 3.6%. The vacancy rate was up over the previous quarter, with net absorption totaling negative (517,362) square feet in the third quarter. Vacant sublease space decreased in the quarter, ending the quarter at 337,738 square feet. Rental rates ended the third quarter at $17.82, an increase over the previous quarter. There was 293,100 square feet still under construction at the end of the quarter.

ABSORPTION

Net absorption for the overall San Francisco Industrial market was negative (517,362) square feet in the third quar- ter 2015. That compares to positive 89,907 square feet in the second quarter 2015, positive 111,275 square feet in the first quarter 2015, and positive 255,214 square feet in the fourth quarter 2014.

Tenants moving out of large blocks of space in 2015 include: Nippon Express U.S.A. moving out of (188,000) square feet at 250 Utah Ave, Tyco Electronics moving out of (184,462) square feet at 300 Constitution Dr, and Hajoca Corporation moving out of (40,000) square feet at 1111 Connecticut St.

Tenants moving into large blocks of space in 2015 include: Green Leaf moving into 105,600 square feet at 455 Valley Dr, Invitae Corporation moving into 103,213 square feet at 1400 16th St, and Flying Food Group moving into 69,500 square feet at 240 Littlefield Ave.

The Flex building market recorded net absorption of posi- tive 26,642 square feet in the third quarter 2015, compared to positive 203,145 square feet in the second quarter 2015, positive 104,924 in the first quarter 2015, and positive 114,780 in the fourth quarter 2014.

The Warehouse building market recorded net absorption of negative (544,004) square feet in the third quarter 2015 compared to negative (113,238) square feet in the second quarter 2015, positive 6,351 in the first quarter 2015, and posi- tive 140,434 in the fourth quarter 2014.

VACANCY

The Industrial vacancy rate in the San Francisco market area increased to 3.6% at the end of the third quarter 2015. The vacancy rate was 3.2% at the end of the second quarter 2015, and remained at 3.7% at the end of the first quarter 2015 compared to the previous quarter.

Flex projects reported a vacancy rate of 3.9% at the end of the third quarter 2015, 4.0% at the end of the second quarter 2015, 5.0% at the end of the first quarter 2015, and 5.4% at the end of the fourth quarter 2014.

3RDqtrGRAPH

Warehouse projects reported a vacancy rate of 3.5% at the end of the third quarter 2015, 3.0% at the end of second quarter 2015, 3.3% at the end of the first quarter 2015, and 3.1% at the end of the fourth quarter 2014.

SUBLEASE VACANCY

The amount of vacant sublease space in the San Francisco market decreased to 337,738 square feet by the end of the third quarter 2015, from 339,249 square feet at the end of the second quarter 2015. There was 333,754 square feet vacant at the end of the first quarter 2015 and 285,144 square feet at the end of the fourth quarter 2014.

San Francisco’s Flex projects reported vacant sublease space of 159,239 square feet at the end of third quarter 2015, down from the 164,850 square feet reported at the end of the second quarter 2015. There were 186,108 square feet of sub- lease space vacant at the end of the first quarter 2015, and208,699 square feet at the end of the fourth quarter 2014.

Warehouse projects reported increased vacant sublease space from the second quarter 2015 to the third quarter 2015. Sublease vacancy went from 174,399 square feet to 178,499 square feet during that time. There was 147,646 square feet at the end of the first quarter 2015, and 76,445 square feet at the end of the fourth quarter 2014.

RENTAL RATES
The average quoted asking rental rate for available Industrial space was $17.82 per square foot per year at the end of the third quarter 2015 in the San Francisco market area. This represented a 1.7% increase in quoted rental rates from the end of the second quarter 2015, when rents were reported at $17.52 per square foot.

The average quoted rate within the Flex sector was $28.42 per square foot at the end of the third quarter 2015, while Warehouse rates stood at $13.76. At the end of the sec- ond quarter 2015, Flex rates were $28.53 per square foot, and Warehouse rates were $13.03.

DELIVERIES AND CONSTRUCTION

During the third quarter 2015, no new space was completed in the San Francisco market area. This compares to 0 buildings completed in the second quarter 2015, three buildings totaling 118,080 square feet completed in the first quarter 2015, and nothing completed in the fourth quarter 2014.

There were 293,100 square feet of Industrial space under construction at the end of the third quarter 2015.

Some of the notable 2015 deliveries include: 901 Rankin St, an 82,480-square-foot facility that delivered in first quarter 2015 and is now 100% occupied, and 1 Kelly Ct, a 25,600- square-foot building that delivered in first quarter 2015 and is now 100% occupied.

The largest projects underway at the end of third quarter 2015 were The Cove – Building 3, a 153,047-square-foot building with 0% of its space pre-leased, and The Cove – Building 4, a 140,053-square-foot facility that is 0% pre-leased.

INVENTORY

Total Industrial inventory in the San Francisco market area amounted to 94,065,666 square feet in 4,812 buildings as of the end of the third quarter 2015. The Flex sector consisted of 23,919,746 square feet in 791 projects. The Warehouse sector consisted of 70,145,920 square feet in 4,021 buildings. Within the Industrial market there were 520 owner-occupied buildings accounting for 12,959,398 square feet of Industrial space.

SALES ACTIVITY

Tallying industrial building sales of 15,000 square feet or larger, San Francisco industrial sales figures fell during the sec- ond quarter 2015 in terms of dollar volume compared to the first quarter of 2015.

In the second quarter, 11 industrial transactions closed with a total volume of $88,245,000. The 11 buildings totaled 423,420 square feet and the average price per square foot equated to $208.41 per square foot. That compares to 17 transactions totaling $180,790,000 in the first quarter. The total square footage was 870,221 for an average price per square foot of $207.75.

Total year-to-date industrial building sales activity in 2015 is down compared to the previous year. In the first six months of 2015, the market saw 28 industrial sales transac- tions with a total volume of $269,035,000. The price per square foot has averaged $207.97 this year. In the first six months of 2014, the market posted 30 transactions with a total volume of $275,279,100. The price per square foot averaged $211.04.

Cap rates have been lower in 2015, averaging 4.34%, compared to the first six months of last year when they aver- aged 6.58%.

Full Report: 3rdQTR_Industrial

Robust CRE Space Absorption Bolstered Recent Price Gains

Source: CoStar
By: Mark Heschmeyer
Date Posted: October 14, 2015

While construction has been rising in many markets, aggregate demand across the major property types continues to outstrip supply, resulting in lower vacancy rates and rent growth. This, in turn, continues to drive strong investor interest in commercial real estate, according to the latest CoStar Commercial Repeat Sale Indices (CCRSI).

Pages from ccrsi-october2015

In August 2015, the two broadest measures of aggregate pricing for commercial properties within the CCRSI-the value-weighted U.S. Composite Index and the equal-weighted U.S. Composite Index-increased by 1.3% and 1%, respectively, and 12.6% and 11.4%, respectively, in the 12 months ended August 2015.

Click here for the full CCRSI October release and supporting materials: Commercial Repeat Sale Indices

Recent stronger growth in the General Commercial segment, which is influenced by smaller, lower-value properties, confirms a broad-based pricing recovery. Within the equal-weighted U.S. Composite Index, the General Commercial segment posted a monthly increase of 1% in August 2015 and 11.9% for the 12 months ended August 2015, propelling the index to within 7% of its pre-recession high.

Robust CRE Space Absorption Bodes Well for Continued Favorable Property Sales Conditions

For the four quarters ended as of the third quarter of 2015, net absorption across the three major property types-office, retail, and industrial-totaled 611.4 million square feet. That is 20% more than in the four quarters ended as of the third quarter of 2014. It is also the second-highest annualized absorption total on record since 2008.

The office and industrial sectors turned in particularly strong performances during this 12-month period, averaging net absorption of 0.3% and 0.4% of inventory, respectively. The the retail sector averaged a more modest 0.2% in the trailing four quarters ended as of the third quarter of 2015.

The CCRSI’s U.S. composite pair volume of $79.5 billion year-to-date through August 2015 was a 32% increase compared with the same period in 2014. This suggests that 2015 could be another record year for commercial real estate acquisitions.

Both the high and low end of the market are attracting increased capital flows, with volume up by nearly 32% in both the Investment-Grade and General Commercial segments.

Link to Article: CRE Property Price Growth Heats Up

Calco Commercial represented the Buyer in the recent purchase of 111 S. Maple Avenue in South San Francisco. 111 South Maple Avenue consists of 27,360+/- square feet of commercial warehouse construction situated on a larger 1.25 acre lot. The warehouse boasts high ceilings, heavy power and close proximity to Highway 101, I-280, I-380 and SFO.

111_S_Maple

Calco Commercial has completed nearly 60 lease and sale transactions over the last year, representing approximately 450,000 square feet of commercial product. Calco continues to lead the San Francisco brokerage industrial marketplace. The Bay Area commercial properties continue to demand premium rental and sale rates as inventory and vacancies shrink.

Calco Commercial is a full service outfit that can help you make the most of your real estate properties and investments. If you would like to discuss your real estate options, or would simply like more information related to current market conditions, please call our office at 415.970.0000.

Source: San Francisco Business Times
By: Cory Weinberg
Date Posted: September 28, 2015

Surrounding the Anchor Steam Brewing Co. headquarters in Potrero Hill, the real-estate equivalent of a late-night bar brawl has been raging in the neighborhood.

Most major residential projects proposed for Potrero Hill are in the melee, but developer Related California is trying to rise above the fray a block from the brewery at 1601 Mariposa St. Related California sliced the number of rental units in its controversial Potrero Hill apartment proposal by 7 percent and boosted the percentage of affordable housing as it stares down a date with the Planning Commission next month.

The 1601 Mariposa proposal — two four-story buildings pitched three years ago to replace a warehouse and parking lots on the northern slope of Potrero Hill — shrunk its project from 320 units to 299 units after criticism from neighborhood groups that the apartment would crowd the neighboring Live Oaks private school.

renderings_aug15_02

The developer also set aside 20 percent of the project for people making about half of the city’s median income instead of the initial required 14 percent. The project includes 28,000 square feet of public open space, and the developer has mulled another increase in the number of three-bedroom units to draw more families to the neighborhood. To help ease traffic, the project will swap out some retail space for workspace that will house small manufacturers.

“I’m sure you could find 10 people to disagree with me, but we’ve had a lot of big meetings lately, and I think people really like the plan in general – those who aren’t just opposed to any density at all,” said Bill Witte, Related California’s president and CEO. “The question is – which isn’t unusual in San Francisco – which community benefits are you willing to agree to to make it more neighborhood friendly, more affordable?”

The project is slated to get a large project authorization from the Planning Commission on Oct. 22, which would mostly greenlight it for construction. (The threats of lawsuits could always slow things down, of course.)

It would be one of the largest built in the neighborhood in recent memory and is part of a string of dense development there, including the 395-unit 1200 17th St. and the 234-unit 1301 16th St.

The 1601 Mariposa project – designed by David Baker Architects – already mostly conformed with current zoning under 2009’s Eastern Neighborhoods Plan. A city environmental study found the project would have significant and unavoidable traffic impacts at just one of 13 intersections studied – Mariposa and Mississippi streets. Combined with other projects that are in the development queue, the intersection of 16th and Arkansas streets will also get squeezed. Muni congestion would be insignificant, the study found.

The problem is that Potrero Hill – along with neighboring Dogpatch– has seen a string of residential proposals that add badly needed housing to the city’s stock, but rankled neighbors who are starting to see heavy construction with little transit or park improvements to show for it. (The 1601 Mariposa development would pay about $4 million in fees for the city to acquire and upgrade city parks.)

A group opposed to 1601 Mariposa, called “Grow Potrero Responsibly,” has said that the project would further congest Muni, provide insufficient parking and would be too dense for the neighborhood. The site is also zoned “urban-mixed use,” a designation that allows for flexible use and has paved the way for housing to replace production, distribution and repair (PDR) businesses.

J.R. Eppler, who heads the Potrero Boosters neighborhood group, said he only had quibbles with the project and that much of the large differences had been resolved. The group will vote on endorsing the project Tuesday.

The census tracts surrounding the 1601 Mariposa project include median household incomes that are about double the city as a whole and that also have much higher home-ownership rates. The neighborhood is attractive to builders not only for its zoning but for its proximity to technology and biotech headquarters in South of Market and Mission Bay.

While few projects have been completed so far, the Potrero Hill/Showplace Square plan area includes 19 percent of the city’s total units approved for construction, according to the city’s Housing Inventory report.

Adding to the irritation, the Warriors arena proposal, Pier 70, and the Giants’ Mission Rock development are large projects that will sit nearby. (Those haven’t galvanized significant, organized opposition in Potrero Hill, however.)

The Planning Commission is due for a briefing on the Potrero Hill/Showplace Square plan area this Thursday. Meanwhile, developers fighting against a proposed moratorium on market-rate in the Mission District have feared a similarly drastic measure in Potrero Hill.

Eppler of the Potrero Boosters said neighbors aren’t mulling a moratorium but want the Planning Department to re-evaluate the Eastern Neighborhoods plan as it “reaches the end of the pipeline” of construction planned there.

“There needs to be the political will necessary to devote a significant amount of resources to Potrero Hill, Dogpatch, Mission Bay, South Beach and to connect dots of development to implement new systems that will allow them to operate together,” Eppler said.

link to article: Potrero Housing

Despite Investor Concerns of Overheating, Market Indicators Support CRE Pricing
Re-posted: CoStar News
By: Randyl Drummer

As commercial real estate prices have continued to surge, some have become concerned that valuations may be overheating or even reaching bubble levels as a combination of high demand, low interest rates and loosening loan underwriting standards contribute to a record spike in deal activity and price paid per square foot for trophy properties in top U.S. and global markets.

But while investors and analysts agree the surging demand for commercial property should be closely scrutinized for signs of overheating, several market indicators appear to reflect solid justification for the upswing in prices. So while peaking prices are a concern, analysts said it is premature to characterize the recent valuation increases as a ‘bubble’ that will inevitably lead to a market correction.

shutterstock_270941090_for web

Rather, they said, the price increases seen over the past 12 months appear to be a direct function of the long period of low interest rates in a low-yield environment, coupled with strengthening fundamentals and rising property-income levels.

“Indicating that we are not in a bubble, we are still seeing a wide pricing gap for taking risk that did not exist in 2006 and 2007, when vacant buildings could fetch premium pricing because investors did not have to wait for leases to expire to get at the embedded rent growth,” said Walter Page, director of U.S. research, office, for CoStar Portfolio Strategy. “Capital is very risk adverse compared to 2007.”

Perhaps most significantly, Page added, previous pricing bubbles have burst only after developers flooded the market with a large supply of new space within a very short time. With the possible exception of the office construction boom in Houston, this is not the case today.

Showing a measure of caution following recent stock market volatility and swings in August and into September, property investors appear to be taking a pause to assess conditions, with previously acquisition-minded investors now saying, “Not so fast.”

In recent meetings with several major investors, Page said the discussions have changed tone and now focus on not rushing in and taking their time to place money. As a result, they expressed expectations that sales volumes may slow somewhat in the second half of 2015, Page said.

Price appreciation has also slowed, both from earlier this year and compared with the early to mid-recovery period from 2010 to 2013, suggesting that pricing is reaching market-clearing levels, added Page.

Using the term ‘bubble’ to describe the current pricing advances gives the false perception that the market is not stable and is ready to burst,” notes Andrew Nelson, chief economist for Colliers International.

“Investors like to buy closer to the bottom, and it certainly seems we’re closer to the top, even if not quite necessarily there,” Nelson said. “At the same time, market fundamentals are strong and getting stronger, and I do believe we have some time left on the clock in terms of continued economic growth.”

While the abundant supply of cash looking to find a home in U.S. properties is helping to propel sales, only about half of U.S. office markets are achieving pricing above the last peak, with top-tier markets like San Francisco, New York and San Jose leading the way. Other major world cities show a similar trend.

CoStar sales data shows record CRE sales volumes in all product types totaling $600 billion over the past four quarters, which is 7% above the 2007 record of $556 billion, and up by 23% from the four-quarter period a year earlier.

Office sales of $148 billion over the past four quarters trail the record $203 billion in 2007, which included $60 billion in sales and re-trading stemming from sale of Equity Office Properties to Blackstone, which some consider to mark the previous cycle’s peak. The current four-quarter sales volume represents a 21% increase from a year earlier, so clearly office sales volumes are strong, Page said.

However, the office value appreciation rate has slowed to 2.4% over the past year, down from the 5% to 8% appreciation rate between 2011 and 2013, Page said. Value increases over the past year have ranged from just over 4% in the San Francisco Bay area to less than 1% in Chicago, Seattle, and Denver.

A marked slowdown in cap rate compression, from 50 to 90 basis points per year during the 2010-2013 period to a 20 bps decline over the past year, also has contributed to the slowing depreciation.

“Because of the expectation of rising interest rates, we are forecasting that the current 5.7% national office cap rate will mark a market bottom, with a rise of 20 basis points forecasted by 2018,” Page said.

Valuations should increase in most markets for several more years, suggests that the growing strength of local economies will be a key factor in improving property returns, Page said.

“Our forecasted annual returns through 2019 range from over 9% for San Francisco and Nashville to 2% for Houston and Washington, D.C.”

Also, rent levels in a large number of metros have not yet risen to the point that justifies new office construction. With the exception of multifamily, levels of new supply remain moderate in most property types, particularly the office market, where construction is almost exactly at its long-term average of roughly 124 million square feet per year, well below the 184 million square feet added at the peak of the last market bubble, Page pointed out.

Moreover, the construction is highly concentrated in about one-third of U.S. markets, led by Houston and New York with 13 million square feet. Seattle, San Jose and San Francisco are also hot spots for office construction.

The remaining two-thirds of markets have roughly half their historical level of new office construction, yet the vacancy rates for these markets are about the same as in 2007.

Globally, property is expensive on a per-pound basis in some top markets, and cap rates are low for the best properties, typically signaling modest returns and expensive pricing, Colliers’ Nelson agrees. With inflation and interest rates still very low, however, spreads between cap rates and long-term Treasury note remain above their long-term averages, making pricing look much more reasonable, he added.

Link to article: Market Indicators Support CRE Pricing