Category: san francisco commercial real estate brokers (51)

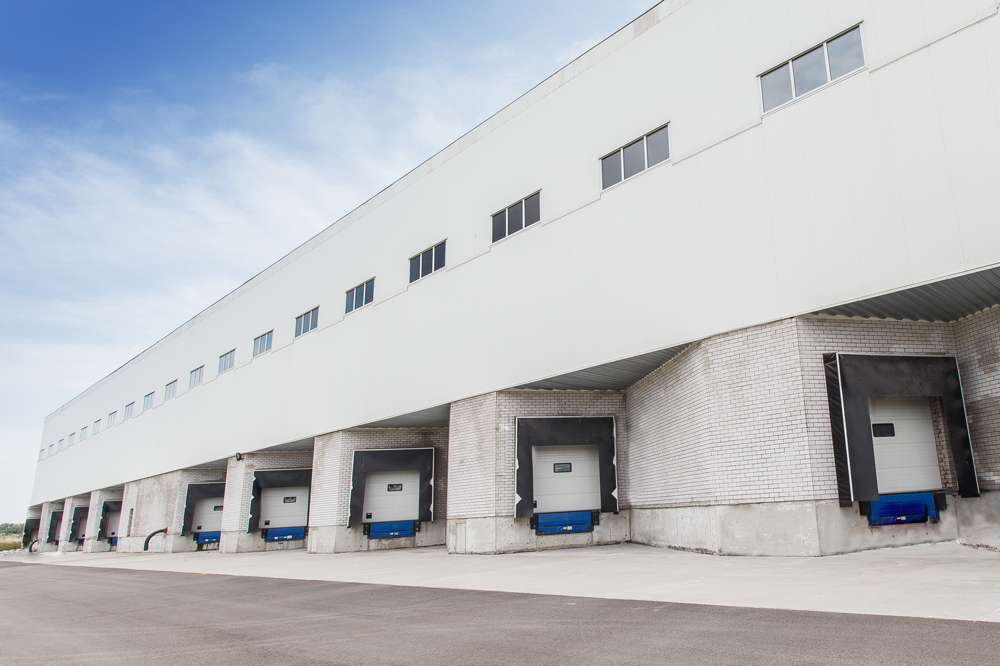
The boom of e-commerce, fueled by Amazon, as created a demand for industrial warehouse space across the nation. But how long can the industrial boom be sustained–can other companies follow the “same day delivery” demands sparked by Amazon, and how will increasing construction costs affect the market? At Bisnow’s National Industrial event in New York, such questions were discussed.

Click here to read the responses including how a lack of truck drivers, old ports, and lack of space may impact the industrial marketplace: Industrial Boom
San Francisco’s Vacancy Increases to 3.6%
Net Absorption Negative (517,362) SF in the Quarter

Source: CoStar

The San Francisco Industrial market ended the third quar- ter 2015 with a vacancy rate of 3.6%. The vacancy rate was up over the previous quarter, with net absorption totaling negative (517,362) square feet in the third quarter. Vacant sublease space decreased in the quarter, ending the quarter at 337,738 square feet. Rental rates ended the third quarter at $17.82, an increase over the previous quarter. There was 293,100 square feet still under construction at the end of the quarter.

ABSORPTION

Net absorption for the overall San Francisco Industrial market was negative (517,362) square feet in the third quar- ter 2015. That compares to positive 89,907 square feet in the second quarter 2015, positive 111,275 square feet in the first quarter 2015, and positive 255,214 square feet in the fourth quarter 2014.

Tenants moving out of large blocks of space in 2015 include: Nippon Express U.S.A. moving out of (188,000) square feet at 250 Utah Ave, Tyco Electronics moving out of (184,462) square feet at 300 Constitution Dr, and Hajoca Corporation moving out of (40,000) square feet at 1111 Connecticut St.

Tenants moving into large blocks of space in 2015 include: Green Leaf moving into 105,600 square feet at 455 Valley Dr, Invitae Corporation moving into 103,213 square feet at 1400 16th St, and Flying Food Group moving into 69,500 square feet at 240 Littlefield Ave.

The Flex building market recorded net absorption of posi- tive 26,642 square feet in the third quarter 2015, compared to positive 203,145 square feet in the second quarter 2015, positive 104,924 in the first quarter 2015, and positive 114,780 in the fourth quarter 2014.

The Warehouse building market recorded net absorption of negative (544,004) square feet in the third quarter 2015 compared to negative (113,238) square feet in the second quarter 2015, positive 6,351 in the first quarter 2015, and posi- tive 140,434 in the fourth quarter 2014.

VACANCY

The Industrial vacancy rate in the San Francisco market area increased to 3.6% at the end of the third quarter 2015. The vacancy rate was 3.2% at the end of the second quarter 2015, and remained at 3.7% at the end of the first quarter 2015 compared to the previous quarter.

Flex projects reported a vacancy rate of 3.9% at the end of the third quarter 2015, 4.0% at the end of the second quarter 2015, 5.0% at the end of the first quarter 2015, and 5.4% at the end of the fourth quarter 2014.

3RDqtrGRAPH

Warehouse projects reported a vacancy rate of 3.5% at the end of the third quarter 2015, 3.0% at the end of second quarter 2015, 3.3% at the end of the first quarter 2015, and 3.1% at the end of the fourth quarter 2014.

SUBLEASE VACANCY

The amount of vacant sublease space in the San Francisco market decreased to 337,738 square feet by the end of the third quarter 2015, from 339,249 square feet at the end of the second quarter 2015. There was 333,754 square feet vacant at the end of the first quarter 2015 and 285,144 square feet at the end of the fourth quarter 2014.

San Francisco’s Flex projects reported vacant sublease space of 159,239 square feet at the end of third quarter 2015, down from the 164,850 square feet reported at the end of the second quarter 2015. There were 186,108 square feet of sub- lease space vacant at the end of the first quarter 2015, and208,699 square feet at the end of the fourth quarter 2014.

Warehouse projects reported increased vacant sublease space from the second quarter 2015 to the third quarter 2015. Sublease vacancy went from 174,399 square feet to 178,499 square feet during that time. There was 147,646 square feet at the end of the first quarter 2015, and 76,445 square feet at the end of the fourth quarter 2014.

RENTAL RATES
The average quoted asking rental rate for available Industrial space was $17.82 per square foot per year at the end of the third quarter 2015 in the San Francisco market area. This represented a 1.7% increase in quoted rental rates from the end of the second quarter 2015, when rents were reported at $17.52 per square foot.

The average quoted rate within the Flex sector was $28.42 per square foot at the end of the third quarter 2015, while Warehouse rates stood at $13.76. At the end of the sec- ond quarter 2015, Flex rates were $28.53 per square foot, and Warehouse rates were $13.03.

DELIVERIES AND CONSTRUCTION

During the third quarter 2015, no new space was completed in the San Francisco market area. This compares to 0 buildings completed in the second quarter 2015, three buildings totaling 118,080 square feet completed in the first quarter 2015, and nothing completed in the fourth quarter 2014.

There were 293,100 square feet of Industrial space under construction at the end of the third quarter 2015.

Some of the notable 2015 deliveries include: 901 Rankin St, an 82,480-square-foot facility that delivered in first quarter 2015 and is now 100% occupied, and 1 Kelly Ct, a 25,600- square-foot building that delivered in first quarter 2015 and is now 100% occupied.

The largest projects underway at the end of third quarter 2015 were The Cove – Building 3, a 153,047-square-foot building with 0% of its space pre-leased, and The Cove – Building 4, a 140,053-square-foot facility that is 0% pre-leased.

INVENTORY

Total Industrial inventory in the San Francisco market area amounted to 94,065,666 square feet in 4,812 buildings as of the end of the third quarter 2015. The Flex sector consisted of 23,919,746 square feet in 791 projects. The Warehouse sector consisted of 70,145,920 square feet in 4,021 buildings. Within the Industrial market there were 520 owner-occupied buildings accounting for 12,959,398 square feet of Industrial space.

SALES ACTIVITY

Tallying industrial building sales of 15,000 square feet or larger, San Francisco industrial sales figures fell during the sec- ond quarter 2015 in terms of dollar volume compared to the first quarter of 2015.

In the second quarter, 11 industrial transactions closed with a total volume of $88,245,000. The 11 buildings totaled 423,420 square feet and the average price per square foot equated to $208.41 per square foot. That compares to 17 transactions totaling $180,790,000 in the first quarter. The total square footage was 870,221 for an average price per square foot of $207.75.

Total year-to-date industrial building sales activity in 2015 is down compared to the previous year. In the first six months of 2015, the market saw 28 industrial sales transac- tions with a total volume of $269,035,000. The price per square foot has averaged $207.97 this year. In the first six months of 2014, the market posted 30 transactions with a total volume of $275,279,100. The price per square foot averaged $211.04.

Cap rates have been lower in 2015, averaging 4.34%, compared to the first six months of last year when they aver- aged 6.58%.

Full Report: 3rdQTR_Industrial

Calco Commercial represented the Buyer in the recent purchase of 111 S. Maple Avenue in South San Francisco. 111 South Maple Avenue consists of 27,360+/- square feet of commercial warehouse construction situated on a larger 1.25 acre lot. The warehouse boasts high ceilings, heavy power and close proximity to Highway 101, I-280, I-380 and SFO.

111_S_Maple

Calco Commercial has completed nearly 60 lease and sale transactions over the last year, representing approximately 450,000 square feet of commercial product. Calco continues to lead the San Francisco brokerage industrial marketplace. The Bay Area commercial properties continue to demand premium rental and sale rates as inventory and vacancies shrink.

Calco Commercial is a full service outfit that can help you make the most of your real estate properties and investments. If you would like to discuss your real estate options, or would simply like more information related to current market conditions, please call our office at 415.970.0000.

Source: San Francisco Business Times
By: Cory Weinberg
Date Posted: September 28, 2015

Surrounding the Anchor Steam Brewing Co. headquarters in Potrero Hill, the real-estate equivalent of a late-night bar brawl has been raging in the neighborhood.

Most major residential projects proposed for Potrero Hill are in the melee, but developer Related California is trying to rise above the fray a block from the brewery at 1601 Mariposa St. Related California sliced the number of rental units in its controversial Potrero Hill apartment proposal by 7 percent and boosted the percentage of affordable housing as it stares down a date with the Planning Commission next month.

The 1601 Mariposa proposal — two four-story buildings pitched three years ago to replace a warehouse and parking lots on the northern slope of Potrero Hill — shrunk its project from 320 units to 299 units after criticism from neighborhood groups that the apartment would crowd the neighboring Live Oaks private school.

renderings_aug15_02

The developer also set aside 20 percent of the project for people making about half of the city’s median income instead of the initial required 14 percent. The project includes 28,000 square feet of public open space, and the developer has mulled another increase in the number of three-bedroom units to draw more families to the neighborhood. To help ease traffic, the project will swap out some retail space for workspace that will house small manufacturers.

“I’m sure you could find 10 people to disagree with me, but we’ve had a lot of big meetings lately, and I think people really like the plan in general – those who aren’t just opposed to any density at all,” said Bill Witte, Related California’s president and CEO. “The question is – which isn’t unusual in San Francisco – which community benefits are you willing to agree to to make it more neighborhood friendly, more affordable?”

The project is slated to get a large project authorization from the Planning Commission on Oct. 22, which would mostly greenlight it for construction. (The threats of lawsuits could always slow things down, of course.)

It would be one of the largest built in the neighborhood in recent memory and is part of a string of dense development there, including the 395-unit 1200 17th St. and the 234-unit 1301 16th St.

The 1601 Mariposa project – designed by David Baker Architects – already mostly conformed with current zoning under 2009’s Eastern Neighborhoods Plan. A city environmental study found the project would have significant and unavoidable traffic impacts at just one of 13 intersections studied – Mariposa and Mississippi streets. Combined with other projects that are in the development queue, the intersection of 16th and Arkansas streets will also get squeezed. Muni congestion would be insignificant, the study found.

The problem is that Potrero Hill – along with neighboring Dogpatch– has seen a string of residential proposals that add badly needed housing to the city’s stock, but rankled neighbors who are starting to see heavy construction with little transit or park improvements to show for it. (The 1601 Mariposa development would pay about $4 million in fees for the city to acquire and upgrade city parks.)

A group opposed to 1601 Mariposa, called “Grow Potrero Responsibly,” has said that the project would further congest Muni, provide insufficient parking and would be too dense for the neighborhood. The site is also zoned “urban-mixed use,” a designation that allows for flexible use and has paved the way for housing to replace production, distribution and repair (PDR) businesses.

J.R. Eppler, who heads the Potrero Boosters neighborhood group, said he only had quibbles with the project and that much of the large differences had been resolved. The group will vote on endorsing the project Tuesday.

The census tracts surrounding the 1601 Mariposa project include median household incomes that are about double the city as a whole and that also have much higher home-ownership rates. The neighborhood is attractive to builders not only for its zoning but for its proximity to technology and biotech headquarters in South of Market and Mission Bay.

While few projects have been completed so far, the Potrero Hill/Showplace Square plan area includes 19 percent of the city’s total units approved for construction, according to the city’s Housing Inventory report.

Adding to the irritation, the Warriors arena proposal, Pier 70, and the Giants’ Mission Rock development are large projects that will sit nearby. (Those haven’t galvanized significant, organized opposition in Potrero Hill, however.)

The Planning Commission is due for a briefing on the Potrero Hill/Showplace Square plan area this Thursday. Meanwhile, developers fighting against a proposed moratorium on market-rate in the Mission District have feared a similarly drastic measure in Potrero Hill.

Eppler of the Potrero Boosters said neighbors aren’t mulling a moratorium but want the Planning Department to re-evaluate the Eastern Neighborhoods plan as it “reaches the end of the pipeline” of construction planned there.

“There needs to be the political will necessary to devote a significant amount of resources to Potrero Hill, Dogpatch, Mission Bay, South Beach and to connect dots of development to implement new systems that will allow them to operate together,” Eppler said.

link to article: Potrero Housing

Despite Investor Concerns of Overheating, Market Indicators Support CRE Pricing
Re-posted: CoStar News
By: Randyl Drummer

As commercial real estate prices have continued to surge, some have become concerned that valuations may be overheating or even reaching bubble levels as a combination of high demand, low interest rates and loosening loan underwriting standards contribute to a record spike in deal activity and price paid per square foot for trophy properties in top U.S. and global markets.

But while investors and analysts agree the surging demand for commercial property should be closely scrutinized for signs of overheating, several market indicators appear to reflect solid justification for the upswing in prices. So while peaking prices are a concern, analysts said it is premature to characterize the recent valuation increases as a ‘bubble’ that will inevitably lead to a market correction.

shutterstock_270941090_for web

Rather, they said, the price increases seen over the past 12 months appear to be a direct function of the long period of low interest rates in a low-yield environment, coupled with strengthening fundamentals and rising property-income levels.

“Indicating that we are not in a bubble, we are still seeing a wide pricing gap for taking risk that did not exist in 2006 and 2007, when vacant buildings could fetch premium pricing because investors did not have to wait for leases to expire to get at the embedded rent growth,” said Walter Page, director of U.S. research, office, for CoStar Portfolio Strategy. “Capital is very risk adverse compared to 2007.”

Perhaps most significantly, Page added, previous pricing bubbles have burst only after developers flooded the market with a large supply of new space within a very short time. With the possible exception of the office construction boom in Houston, this is not the case today.

Showing a measure of caution following recent stock market volatility and swings in August and into September, property investors appear to be taking a pause to assess conditions, with previously acquisition-minded investors now saying, “Not so fast.”

In recent meetings with several major investors, Page said the discussions have changed tone and now focus on not rushing in and taking their time to place money. As a result, they expressed expectations that sales volumes may slow somewhat in the second half of 2015, Page said.

Price appreciation has also slowed, both from earlier this year and compared with the early to mid-recovery period from 2010 to 2013, suggesting that pricing is reaching market-clearing levels, added Page.

Using the term ‘bubble’ to describe the current pricing advances gives the false perception that the market is not stable and is ready to burst,” notes Andrew Nelson, chief economist for Colliers International.

“Investors like to buy closer to the bottom, and it certainly seems we’re closer to the top, even if not quite necessarily there,” Nelson said. “At the same time, market fundamentals are strong and getting stronger, and I do believe we have some time left on the clock in terms of continued economic growth.”

While the abundant supply of cash looking to find a home in U.S. properties is helping to propel sales, only about half of U.S. office markets are achieving pricing above the last peak, with top-tier markets like San Francisco, New York and San Jose leading the way. Other major world cities show a similar trend.

CoStar sales data shows record CRE sales volumes in all product types totaling $600 billion over the past four quarters, which is 7% above the 2007 record of $556 billion, and up by 23% from the four-quarter period a year earlier.

Office sales of $148 billion over the past four quarters trail the record $203 billion in 2007, which included $60 billion in sales and re-trading stemming from sale of Equity Office Properties to Blackstone, which some consider to mark the previous cycle’s peak. The current four-quarter sales volume represents a 21% increase from a year earlier, so clearly office sales volumes are strong, Page said.

However, the office value appreciation rate has slowed to 2.4% over the past year, down from the 5% to 8% appreciation rate between 2011 and 2013, Page said. Value increases over the past year have ranged from just over 4% in the San Francisco Bay area to less than 1% in Chicago, Seattle, and Denver.

A marked slowdown in cap rate compression, from 50 to 90 basis points per year during the 2010-2013 period to a 20 bps decline over the past year, also has contributed to the slowing depreciation.

“Because of the expectation of rising interest rates, we are forecasting that the current 5.7% national office cap rate will mark a market bottom, with a rise of 20 basis points forecasted by 2018,” Page said.

Valuations should increase in most markets for several more years, suggests that the growing strength of local economies will be a key factor in improving property returns, Page said.

“Our forecasted annual returns through 2019 range from over 9% for San Francisco and Nashville to 2% for Houston and Washington, D.C.”

Also, rent levels in a large number of metros have not yet risen to the point that justifies new office construction. With the exception of multifamily, levels of new supply remain moderate in most property types, particularly the office market, where construction is almost exactly at its long-term average of roughly 124 million square feet per year, well below the 184 million square feet added at the peak of the last market bubble, Page pointed out.

Moreover, the construction is highly concentrated in about one-third of U.S. markets, led by Houston and New York with 13 million square feet. Seattle, San Jose and San Francisco are also hot spots for office construction.

The remaining two-thirds of markets have roughly half their historical level of new office construction, yet the vacancy rates for these markets are about the same as in 2007.

Globally, property is expensive on a per-pound basis in some top markets, and cap rates are low for the best properties, typically signaling modest returns and expensive pricing, Colliers’ Nelson agrees. With inflation and interest rates still very low, however, spreads between cap rates and long-term Treasury note remain above their long-term averages, making pricing look much more reasonable, he added.

Link to article: Market Indicators Support CRE Pricing

CompStak:  San Francisco Office Rents Continue Their Rise
Re-posted from:  The Registry Bay Area Real Estate
By:  Robert Carlsen
Date Posted:  August 30, 2015

Many brokers, appraisers and developers have experienced San Francisco’s strong first half of the year in commercial real estate, with demand for office space continuing to outpace supply and office rents increasing across all building classes and submarkets.

While Class A and B buildings in San Francisco both had quiet starts to 2015, they recently picked up to close the first half of the year in the black, according to CompStak Exchange, a New York-based commercial real estate database specializing in lease comparables.

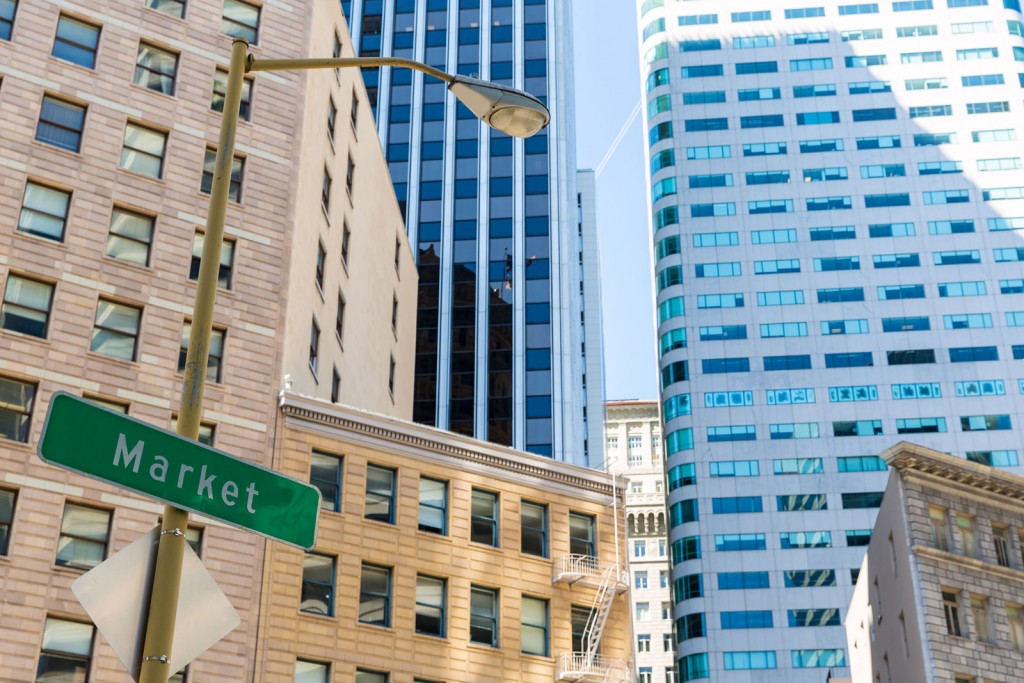
Market-Street_FOR-WEB

CompStak’s second quarter 2015 effective rent report said that Class A effective office rents in San Francisco were up 6.6 percent to $65.29 per square foot over the previous six months and Class B buildings performed even better, with effective rents increasing 12 percent to $59.40 per square foot over the same time period.

And with the tightness of available office space comes the absence of perks. “Landlords who also own property in markets outside of San Francisco know how favorable market conditions really are,” the report said. “Concessions given in San Francisco are far below comparable markets like Los Angeles, Manhattan and Washington, D.C.”

“For example, tenants in Washington, D.C., and Los Angeles County receive, on average, twice as much in free rent and tenant-improvement dollars. The strength of the San Francisco leasing market is evident when viewed in this light.”

According to Blake Toline, a CompStak research analyst, most of the demand driving up prices in San Francisco is coming from technology companies, which has been a trend over the past few quarters. The north and south Financial Districts typically have more corporate tenants, such as law, finance and consulting firms, “but that is starting to change as space around the city becomes harder to find, forcing tech tenants that wouldn’t have normally looked at the central business district to sign space there,” he said.

CompStak said that Class B buildings offer space with more character, unique interiors with exposed brick, operable windows and open floor plans, which makes them more attractive to tech tenants.

Toline provided some recent submarket tenant rent increases over the past six months.

In the lower South of Market area, Class B space is up 3.8 percent to $67 per square foot. Recent lease deals in the region include Elance at 475 Brannan St., which featured an 18,000-square-foot expansion, resulting in an effective rent in the mid-$70s; Hipmunk at 434 Brannan St., which included a 17,000-square-foot short-term renewal and saw effective rents in the high $60s; and HoneyBook at 539 Bryant St., which included a 15,000-square-foot rental in the low $70s.

In the south Financial District, Class A space is up 3.5 percent to $69.80 per square foot. Recent lease deals include WeMo Technologies at 555 Market St., which rented 172,000 square feet in the high $60s; Instacart at 50 Beale St. has 56,000 square feet of lease space in the high $60s; and Intercom at 55 2nd St. has 23,000 square feet of space in the mid-$70s range.

Additionally, in the north Financial District, Class A space is up 5 percent to $65 per square foot. Recent deals include a Sheppard Mullin Richter renewal at 4 Embarcadero, with 72,000 square feet of space in the high $70s; Sentient Technologies at 1 California St., with 17,000 square feet going for the low $70s; and HIG Capital at 1 Sansome, with its 11,000 square feet priced in the low $70s.

Link to article: SF Office Rents Continue Their Rise

But in Current Competitive Environment, Other Banks Still Cutting Deals
Source: CoStar
By: Mark Heschmeyer
Posted: July 29, 2015

Even though the Fed today signaled that it remains on course to raise interest rates in September or later this year, a few banks have already begun raising interest pricing on their commercial real estate loans, particularly for multifamily property. While long expected given the overall strength of the economy, the bump in pricing is coming weeks in advance of an expected hike in the Federal Reserve Bank lending rate.

“We’ve seen rates increase, both on the Treasuries and on swaps, and we’ve seen the increase being sustained and we’ve been wanting to raise interest rates for the last several weeks,” said Joseph DePaolo, president and CEO of Signature Bank.

However, DePaolo said his bank wasn’t able to raise rates in the second quarter because their competition wasn’t moving.

“You can’t be a half or more [percentage points] higher because no matter how much they want you and no matter how efficient our commercial real estate team is, half is a half, and it means a lot,” he said, noting the highly competitive lending environment.

But that has changed in the last 10 days.

“We did some due diligence last week and again yesterday (July 20) and found that our competitors were raising their five-year fixed from let’s say as low as 3% to 3.25%,” DePaolo said. “We were 3% and we simply raised ours to 3.5% and that was yesterday.”

While all the signs appear to point to interest rates finally moving up after many previous fals starts, not everyone is convinced that higher rates will finally take hold.

“That’s possible, but there’s no guarantee,” said Peter Ho, chairman, president and CEO of Bank of Hawaii. “We have seen these [trends] in the past, where it sure looks like rates are moving up and margins stabilized only to find out that, it’s not really a trend, it’s an aberration. So it’s definitely possible, but as I said, I just can’t guarantee that.”

With the expected change in rates, Stephen Gordon, chairman, president and CEO of Opus Bank in Irvine, CA, said his bank has been cutting back on multifamily lending, reducing its multifamily loans in its portfolio from 59% of its holdings to 53% this past quarter.

However, while certain banks have begun the shift to more costly money, the improving economy has banks competing intensely for borrowers as they return to market. As a result, aggressive competition for commercial real estate lending is continuing across much of the country.

“In my opinion [lending competition] remains brutal,” said Mark Hoppe, president, CEO of MB Financial Bank in Chicago.

That is particularly true in CRE lending, Hoppe noted. Loan to values are clearly going up and the bank is seeing more relaxation in the amount of guarantees required in some deals.

“We understand that this is the world we live in, a very competitive one, and we’re going to compete on every front but do it where we think it makes sense,” Hoppe said.

CRE Borrowing Moving Beyond Major Metros

René Jones, chief financial officer of M&T Bank, noted a significant shift in CRE lending patterns. In previous quarters, most of the lending growth in M&T’s markets were primarily around the New York City metro area. That’s not the case this past quarter.

“Right now, growth is everywhere,” Jones said.

Total loans in upstate and western New York, were up 4%. In metropolitan New York and Philadelphia, up 8%; in Pennsylvania, up 12%; in Baltimore, up 7%; and in its other regions, loan growth went up 5%.

Other CRE lending trends noted among the nation’s major banks emerged from mid-year earnings conference calls. Highlights follow:

The Eyes on Texas

“The Eyes of Texas” is the school spirit song of the University of Texas at Austin and the University of Texas at El Paso, but from an economic and CRE standpoint all eyes have been on just Houston for the last three quarters. With energy prices not rebounding much from their 2014 collapse, there has been a lot of concern about how Houston multifamily and office properties will hold up.

Although lenders are seeing some softness in the market, second quarter results appear to be muted.

“Our office construction portfolio is very modest in size. And the office term loan portfolio is performing well there,” said Scott J. McLean, president and COO of Zions Bancorp in Salt Lake City. “On the multifamily piece, we’ve had about five, six multifamily transactions that have come out of the construction period and they’re achieving rents that are actually above the pro formas. But clearly, there will be softness there for office and there will be softness in multifamily, but we think our real estate portfolio is about $1.5 billion less going into this downturn than it was going into the 2009 downturn,” McLean said.

However, McLean likes the overall direction of the Houston economy. While job growth won’t be the 80,000 to 100,000 new jobs it has averaged over the last couple of years, McLean said the market could see 10,000 to 20,000 new jobs this year and about 30,000 new housing starts.

“Sure Houston continues to be a dynamic market,” said Keith Cargill, president, CEO of Texas Capital Bancshares, but “there is no change in our view that we will see muted growth in CRE.”

“We know we are early relative to what appears to be still a very healthy market really in all categories. Our multifamily is still extremely strong. Even in our Houston market where we have some projects, I had some concern about six or eight months ago. They are holding up quite nicely and as they complete they seem to be hitting pro forma rates or better. And so we hope that continues,” Cargill said.

“We just believe strongly that you can have too much of a good thing in terms of concentration risk,” he added. “And while today [CRE, building and energy] are three of the healthiest businesses we have, they have more cyclical risk in a down cycle. And that’s the only reason that we are tamping down the growth rate.”

Lending for the Long-Term, Borrowing for the Short-Term

Rapidly escalating CRE prices are a mixed bag for banks. On the one hand, they create demand for loans. Banks are pricing those loans based generally on 10-year payback periods. But with the run-up in CRE values stretching into its fifth year, borrowers are flipping investments much more quickly than that.

Loan prepays are definitely on the high side, said Russ Colombo, president and CEO Bank of Marin in Marin County, CA.

“There is a fair amount of profit-taking going on,” Colombo said.

Link to article: Fed Move

Source: CoStar
Reporter: Randyl Drummer
Date Posted: July 15, 2015

Supported by record levels of absorption and strong leasing, commercial real estate prices rebounded in May, with continued strong recovery in both higher-end properties and accelerating investor interest in smaller, lower-priced assets, according to the latest CoStar Commercial Repeat Sale Indices (CCRSI).

The value-weighted U.S. Composite Index and the equal-weighted U.S. Composite Index gained 1.4% and 1.7%, respectively, in May, according to the data based on 1,258 repeat sales in May and more than 140,000 repeat sales since 1996.

The value-weighted index advanced 12.2% in the trailing 12 months through May and now stands 12% above its prior peak, reflecting the strong recovery of larger, higher-value properties. The equal-weighted index began its recovery later in the cycle but has increased at a faster rate of 14.1% in the trailing 12 months through May 2015 as smaller properties continued to gain favor with investors.

USComposite0515

The momentum shift to lower-quality and smaller properties is also mirrored by the recent growth of the general commercial segment within CCRSI’s equal-weighted index. The General Commercial Index rose by the fastest rate among the four major CRE price indices, 14.6%, for the 12 months through May, while the Investment Grade Index increased 11.9%.

Robust leasing activity is driving price appreciation across more markets and property types. For the 12 months ended at mid-year 2015, net absorption in office, retail, and industrial properties totaled 575.5 million square feet — a 39.3% increase over the same period in 2014 and the highest annual total since 2008.

Net absorption in the general property segment rose 37% over the 12-month period through second-quarter 2015. Meanwhile, net absorption in the investment grade segment remained just as strong, increasing by nearly 40% over the 12 months as commercial tenants continued their flight to higher quality space.
See the full CCRSI July release and supporting materials.

In the office sector, for example, net absorption within 4- and 5-Star properties grew at nearly three times the rate of lesser properties rated 3-Star or lower during the same period.

Investment trading activity in the first five months was well above last year’s total, suggesting that 2015 could be another record year for acquisitions.

In fact, the U.S. composite pair volume of $115.7 billion for the 12 months ended May 2015 was the highest on record for the CCRSI, an indication that capital flows into real estate remain very strong. The percentage of trades defined as distressed continued to decline in May among both investment-grade and general CRE properties.

Link to Article: CRE Price Appreciation

Exclusive: One of the World’s biggest developers hunts for mega projects in Oakland, S.F.
Source: San Francisco Business Times
Reporter: Cory Weinberg
Date Posted: June 30, 2015

One of the world’s largest real estate developers, Shanghai-based Greenland Holding Group, is in talks to invest and build in the Bay Area for the first time, the company’s U.S. head told the San Francisco Business Times.

commercial real estate

I-Fei Chang, who is overseeing $6 billion worth of development for Greenland’s Los Angeles-based subsidiary, is looking for opportunities to park billions more. She said she travels to the Bay Area “biweekly” to meet with local companies and city officials about building the company’s third U.S. project here.

A development deal would draw even more Chinese capital to Bay Area real estate and introduce to the region an investor that has so far been elusive. But for a foreign company only looking at mammoth deals, finding the right project can be a headache.

“We do have something (in the Bay Area) in mind. We are busy paddling,” she told the Business Times at a National Association of Real Estate Editors conference in Miami. “It’s like a duck — you keep calm on the surface of the water but the feet are quite busy paddling in the water.”

“It always takes time. We wish it could be quicker,” added Chang, a native of Taiwan and a graduate of Yale University. “It just really depends on the accessibility of the projects that we’d have the opportunity to invest.”

Greenland Holding claims to be world’s largest property developer by floor space under construction (250 million square feet) and by sales revenue ($40 billion), the Wall Street Journal reported.

The company, which is owned by the Chinese government, took a pass on investing in Lennar Urban’s $8 billion Hunters Point Shipyard project. It instead bought a majority stake in Forest City’s $4.9 billion Pacific Park Brooklyn project next to Barclays Center. Last year, Greenland broke ground on the $1-billion downtown Los Angeles hotel, condominium and shopping complex called Metropolis, which it bought in 2013.

Greenland USA then took another stab at investing in San Francisco. Late last year, the company lost out to Shanghai-based Oceanwide Holdings in buying the First and Mission Streets property– which will span 2 million square feet of office, condominium and hotel space by 2019.

Greenland Holding has invested about $20 billion in overseas development projects since 2013, including developments in London, Sydney and Toronto. The company has more than $55 billion in global assets, according to a report by Knight Frank. Chinese builders have looked toward the western world mostly because their own residential market has cooled significantly. The Chinese government has also recently relaxed limits on outbound investments.

Investment hurdles

Greenland USA is looking to develop large mixed-use projects like their deals in Brooklyn and Los Angeles, Chang said. That separates Greenland from other Chinese developers like Vanke, the Lumina condo complex joint venture partner, and R&F Properties, the 555 Fulton St. developer, who have focused on solely residential projects.

Chang wouldn’t say how deep current development talks are. She also spoke at length about investing in areas of cities that are undergoing “transformation” and in need of middle-class housing. But she also lamented rising construction and labor costs as the U.S. real estate market heats up.

She said construction costs have risen by 20 percent on Greenland’s two current U.S. projects since the company got involved.

“We have the stomach, and we envision there’s so much space that’s under transformation quickly,” she said. “But we still want to break even with what we build… We also see some prices that are overheated and those prices go sky high. That concerns us.”

Rob Hielscher, the Western U.S. head of JLL’s International Capital Group, said a many development projects make financial sense in San Francisco, but finding large-scale development opportunities can be a struggle, particularly with the city’s Proposition M office space cap limiting the amount of office space that developers can deliver in San Francisco.

“The bigger issue is the lack of large-scale development opportunities that are currently available for groups like Greenland to purchase or invest in” he said.

Some of the biggest mixed-use projects in San Francisco’s development pipeline include Forest City’s 5M and Pier 70 projects, the Giants’ Mission Rock and Kilroy Realty Corp.’s Flower Mart. Only the Giants’ project has priority to squeeze under the office space cap.

The only mixed-use proposals of over 1 million square feet in Oakland is the Brooklyn Basin waterfront project, which attracted investment from China’s Zarsion Holdings two years ago, and East Oakland’s Coliseum City, which is fraught with political risk.

But if it does find the right deal, Greenland’s global clout will likely give it a leg up over other Chinese investors that may be less recognizable to U.S. builders, Hielscher said. “They’re a name brand that many domestic groups would want to work with,” Hielscher said.

Ready for Oakland?

Zhang Yuliang, Greenland Holding Group’s chairman, told reporters in December, that “we’d increase our investment in cities where there is potential for growth, in the big cities.”

In the Bay Area, that doesn’t just mean San Francisco. Rachel Flynn, Oakland’s planning director, and Darlene Chiu Bryant, head of the San Francisco-backed nonprofit China SF, confirmed that Greenland has met with officials from both cities about development opportunities recently.

“They seemed really interested in our city, but nothing seems imminent,” Flynn said, who added that the city told Greenland about its upcoming downtown specific plan that should clear hurdles for development. “It will be interesting to see what they end up focusing on.”

Chang seemed high on Oakland. She brushed off a question about what made her enthusiastic about a city that struggles to attract big investors because of a reputation for crime and poor government, as well as its uncertain payoff on building highrises.

Instead, she extolled Oakland’s short commute to San Francisco on BART, the proximity to the University of California at Berkeley, and the city’s waterfront.

“There’s no crime in the city if you have believers who want to believe they’re pioneers.” she said. “Why can’t we have more housing projects for the middle class that includes an easy commute? Oakland is just like a Brooklyn for us on the Pacific side.”

“It’s all about what we can do for your city and how we can have that partnership,” she added.

Interview with I-Fei Chang

What is Greenland’s mission?

It’s our mission to not only bring over Chinese capital but expertise of large-scale, mixed-use urban experience that we have in China and from our development experience in the U.K., Canada, Malaysia. We hope to invest and reach out to the community to understand the city’s vision. Our long-term partner is the city and community, to be there a long time.

Why did you land in Brooklyn and Los Angeles first? Why not the Bay Area?

Those two markets, we just were lucky to have the opportunity to select the right project at the right time — two important economic-driver kind of projects . Of course, we’d love to have the opportunity to enter the northern gate of California, to be in the Bay Area. It just really depends on the accessibility of the projects that we’d have the opportunity to invest.

You earlier called Los Angeles, not San Francisco, the “capital of the Pacific.” Why is that?

Just the population, the diversity. It’s an entertainment center. But you have the wineries.

Who is your target residential customer in the U.S.?

Two million people buy from us in China. But here it’s most important to provide urban living experiences, to develop mixed-use projects in U.S. cities. Our target customer would be U.S.-based, young professional or early retiree. They just want to enjoy urban living so we provide the facility, the garden, the daycare center, the school and the public green space to get an apartment, hotel or office; that kind of mixed-use project, a one-stop solution.

Are you finding it more difficult to locate and find opportunities in the states?

We need to meet our business cycle. What’s driving this overheated market that we are cautious of is land price and construction costs. After we obtained these two projects, construction costs rose 20 percent. And the target sales prices of the unit, we have to be cautious about what will be the next opportunity for us to choose. What will be middle-class income, and what is the price they can support if they want condominiums?

Are those opportunities even existing at this point?

Our strategy is certainly for one way to approach private owners and explain to them our vision here, our sense of urgency to make a change here. We reach out to city officials, planners, economic directors, and so on, to see if publicly-owned land can be obtained and have a public-private partnerships.

But how do you get to middle-class housing solutions? In the Bay Area, we have a lack of supply. Market rates are out of reach for the middle class, and those units fund below-market-rate units that middle-class families don’t qualify for.

There are multiple ways. I know architects and developers in Japan and Russia. In Russia, the land is dirt cheap. The land is controlled by the government, so the developers just lease, so the cost is very cheap. It (brings down) the construction costs. The government just needs to be very smart to find some developer with an injection of cash into the government land. There are various ways to utilize urban land.

Link to article: Greenland Holding

Calco Commercial Real Estate has sold 360 Barneveld Avenue. 360 Barneveld Avenue consists of 3,775+/- square feet of clear span warehouse with 16′ ceilings and second floor offices. The property includes one (1) large drive-in door and is located in the Bayshore Corridor Area.

360 Barneveld_Exterior Photo_for Web

If you have any questions about the San Francisco & Peninsula commercial real estate markets or any of our available listings, call our office at 415.970.0000.