Category: industrial real estate san francisco (9)

The reported industrial vacancy rates in San Francisco and surrounding Peninsula areas decreased to 3.5% at the end of Q3 2019 (down from 3.8% in Q2 2019). The Bayshore Corridor of San Francisco witnessed yet another decrease in vacancy to a sub 1% rate of .5% (down from .9% in Q2 2019). The San Francisco/Peninsula market reported a delivery of 21,807+/- square feet of new construction, and 2,568,754 square feet of product under construction, primarily in South San Francisco, Brisbane & Daly City. The industrial core of San Francisco (Bayshore / Potrero Hill / Dogpatch) reported 56,121 square feet of product under construction, with zero deliveries, or construction starts.

Q3 2019 ended with averaged over-all asking rents (industrial and flex) down from $2.30 per square foot to $2.26 per square foot, representing an 1.9% decrease over the previous quarter. Comparatively, current average US industrial asking rents are reported as $.72 per square foot (up from $.71 at the end of Q2 2019). Asking rents specific to warehouse product remained at $1.88 psf at the end of Q3 (no change from Q2). Quoted daily warehouse asking rents for the Bayshore Corridor at the end of Q3 decreased to $1.97 psf from $2.04 psf in Q2. Year-over-year market rents have decreased by 3.9% for the San Francisco/Peninsula industrial/flex market.

Q3 2019 Industrial sale transactions are up from Q2 2019 with $408M in sales volume averaging $334.00 per square foot compared to $308M in sales averaging $328.61 per square foot in Q2 2019. CAP rates averaged 4.9% in Q3 & Q2 2019, representing a minimal increase over Q1 2019 CAP rates of 4.85%. National CAP rates have remained at 6.7% for Q1-Q3 2009.

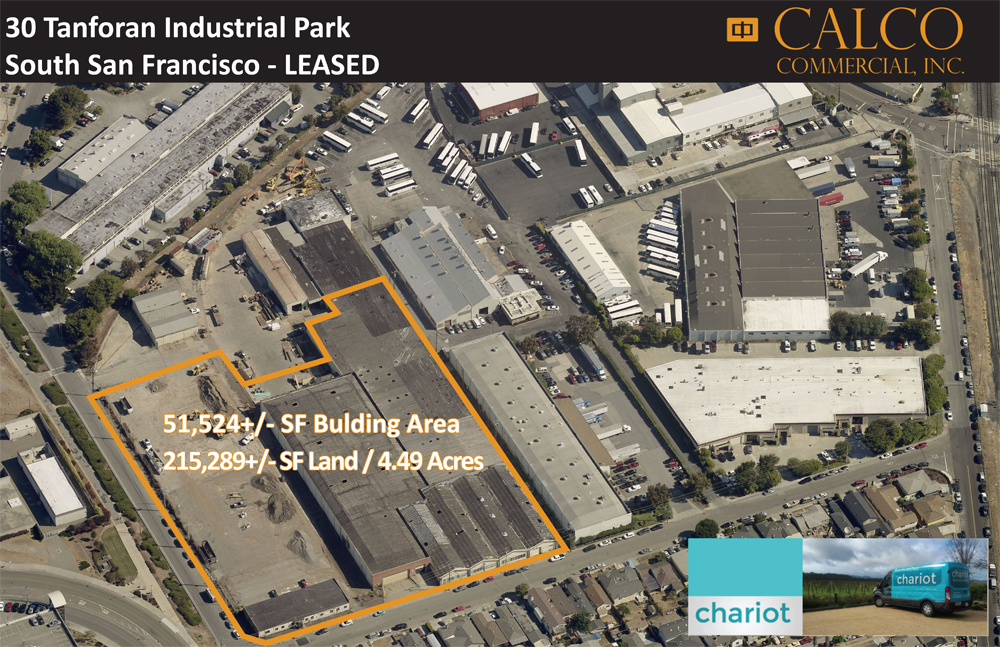
Calco Commercial has leased and sold 1,097,884+/- square feet of industrial, flex, office and land in 2019 comprising 59 transactions, with 179,124+/- square feet and 16 transactions in Q3 alone. Following are the notable Q3 2019 transactions: 253 Utah Avenue, South San Francisco (14,250 +/- sf industrial lease), 81 Dorman Avenue, San Francisco (12,500+/- sf industrial lease), and 3012 Spring Street, Redwood City (5,000/- sf commercial/sale), and 4870 Centennial Boulevard, Colorado Springs (50,000+/- commercial/sale). Calco Commercial is a leading industrial & commercial real estate firm with decades of experience in Landlord /Owner representation, and repositioning assets into net leased properties with in-place income streams. Let us help make the most of your real estate properties and investments.

If you would like to discuss your real estate options, or would simply like more information related to current market conditions, please call our office a 415.970.0000, or directly contact one of our professionals.

Click here for the full report: Q3 2019 Industrial Market Report

Calco Commercial recently completed a lease transaction at the 30 Tanforan Industrial Park in South San Francisco. Calco represented the Chariot, the Tenant, who will be occupying 51,524+/- square feet of building area and a total of 215,289+/- square feet (4.49 acres) of land. Chariot, a division of Ford Smart Mobility, is focused on transit solution by providing transportation options for commuters, enterprises and charters. Chariot operates across the Bay Area and is now offered in cities ranging from Austin to London.

Calco Commercial completed over 70 lease and sale transactions in 2016 totaling over 650,000+/- square feet of industrial, commercial, office and flex spaces in San Francisco and the Peninsula Areas. We are a leading industrial & commercial real estate firm, and consistently complete more transactions in the industrial market than any other firm in San Francisco. We have decades of experience in Landlord /Owner representation, helping Tenants find spaces to fit their needs, and assisting Buyers with net investment properties and trades. Calco Commercial is a full service firm that can help make the most of your real estate properties and investments.

If you would like to discuss your real estate options, or would simply like more information related to current market conditions, please call our office a 415.970.0000, or directly contact one of our professionals.


Source: CoStar News
By: Mark Heschmeyer
Date Posted: November 16, 2016

One group of business owners hasn’t benefitted from the rebound in property prices. Once a real estate mainstay, owner/user purchases of commercial properties by small businesses have declined over the first three quarters of this year, reversing four straight years of increasing sales, CoStar Comps data shows.

small_warehouse_business

Through the first three quarters of this year, owner/user purchases of office, industrial and retail properties ranged from $150,000 to $1.5 million and totaled $8.79 billion. That is down 11% for the same period last year.

By way of comparison, owner/user purchases of properties of more than $1.5 million are ahead of last year’s pace: $20.76 billion for the first three quarters of this year vs. $19.7 billion for the same period last year, which marked a post-recession high.

Higher property prices may be to blame. Property prices in the small business category have been skyrocketing from a low in 2012 of $51.46 per square foot. At the end of September 2016, the average price per square foot for this category had climbed 28% to $66.08 per square foot, fast approaching the 2009 average price peak of nearly $69 per square foot.

By property type, office properties sold in the $150,000 to $1.5 million price range bought by owner/users climbed from an average of $91.12 per square foot in 2012 to $98.61 per square foot at the end of the third quarter of 2016.

Retail prices for such properties bottomed in 2013 at $85.41 per square square foot and are now selling for more than office properties at an average of $99 per square foot.

Prices for industrial properties in the same price range have climbed from an average of $32 per square foot to $42 per square foot for the same period.

At the same time, banks have been cutting back on their real estate lending to small businesses.

Bank lending to small businesses secured by non-residential properties peaked in June 2008. Banks had more than 1.2 million such loans ranging from $100,000 to $1 million on their books at that time totaling $346.6 billion, according to data from the Federal Deposit Insurance Corp. That total had fallen 22% to $271.3 billion at the end of June 2016, the latest data available.

As an interesting side note though, banks make up five of the largest six sellers of properties to small business owner/users in the last two years. Wells Fargo accounted for about $37 million in such sales; PNC Financial Services, $26 million; Fifth Third Bank, $18.5 million; SunTrust Banks, $16.4 million; and Bank of America, $13.5 million, according to CoStar data.

Meanwhile, capital outlays by small businesses has been trending down, according to the National Federation of Independent Businesses, a small business trade group. The percentage of owners surveyed monthly making an outlay peaked for this recovery in July 2015 at 61% and held close to that through January 2016 but has faded since, according to NFIB’s October data.

The percent of owners planning capital outlays in the next three to six months was 27%, an historically weak number. Seasonally adjusted, the net percent expecting better business conditions fell 7 percentage points to a net negative 7%, which means that now, more owners expect that conditions will worsen. Only 9% of small business owners thought that now is a good time to expand.

Link to full article: CoStar-Small Business Lending Decline

Why Office Rents are Surging in these East Bay Cities
Source: San Francisco Business Times
Reporter: Roland Li
Date Posted: June 30, 2015

Rents are rising in the East Bay office submarket along the northern I-680 highway corridor as local companies expand, despite still-high vacancy rates and limited migration from companies outside the area, according to brokerage Newmark Cornish & Carey.

Commercial Real Estate

The submarket, which includes Concord, Walnut Creek and Pleasant Hill, has seen rents increase in some areas by as much as 30 percent, said Tom Fehr, executive vice president and regional manager of Newmark Cornish & Carey. Rents range from $48 per square foot in Class A space in Walnut Creek near the BART station to $24 per square foot in less desirable space in Concord, he said.

The vacancy rate in the submarket of roughly 10 million square feet remains high at 15.3 percent, but it is down from 16.7 percent at the beginning of the year, according to Newmark Cornish & Carey data. Concord has improved to 17.8 percent vacancy, from 20.4 percent at the start of the year.

“What is driving it is organic growth within our market,” said Fehr. “These tenants are not, for the most part, tech companies. The tech companies are staying in San Francisco.”

The northern I-680 submarket is still rebounding from the 2008 recession, when a swath of businesses related to home buying closed, including mortgage bankers, insurers and homebuilders. “We got hit pretty hard. Our recovery’s been much slower,” said Fehr.

Part of the market’s appeal is its proximity to more affordable housing in the East Bay. Workers also typically encounter lighter traffic when driving northeast, in contrast to crossing the Bay Bridge into San Francisco, said Fehr.

Newmark is now fielding more inquiries on space from companies considering a relocation from Oakland or San Francisco. “We’ve been waiting for the spillover to happen probably since the second quarter of 2013,” said Fehr.

Rents aren’t near the $60 per square foot that would justify new construction of office space, and the vacancy rate in the area further discourages any new construction. But if the submarket is able to continue the current momentum to lure more tenants, the area may see its biggest recovery since the recession.

“It’s the first time since 2010 that we’ve had a really dynamic six-month period,” said Fehr.

Link to Article: EAST BAY OFFICE RENTS

Calco Commercial Real Estate has recently leased the following warehouses and offices in the San Francisco marketplace:

540 Barnveld Avenue. This clearspan warehouse space has one (1) drive-in loading door and is 3,950+/- square feet of commercial space and is part of the Valhalla Real Estate Industrial Complex in San Francisco.

455 Barneveld. This 5,830+/- square foot clear span warehouse includes one (1) drive-in loading door and is located within the Valhalla Real Estate Industrial Complex in San Francisco.

NIC PICTO AERIAL_9-24-14_FOR WEB

3130 20th Street #175. This 3,326+/- square foot Central Mission creative space included private and open areas, ground floor location and on-site parking availability.

3130 20th_for web1

75 Industrial. This 22,000+/- square foot clearspan warehouse includes a real yard, two (2) drive-in loading doors, and a high identity corner location in the Bayshore Area of San Francisco.

75 Industrial_Mod_forweb

360 Bayshore Boulevard. This 5,720+/- square foot clearspan warehouse includes one (1) large roll-up door, a small office and a central Bayshore Corridor location. Zoned PDR-1G with the Bayshore Home Improvement Designation, 360 Bayshore Boulevard also allows for retail uses.

360 Bayshore_Aerial_For WEbjpg

2170 Cesar Chavez. This 12,500+/- square foot clearspan warehouse includes four (4) docks, one (1) drive-in loading door, a small office and a large exterior loading and parking area.

2170 Cesar Chavez_Web

If you have any questions about our available properties, or the San Francisco or Peninsula commercial real estate markets, call our office at 415.970.0000.

Commercial real estate, san Francisco commercial real estate, commercial real estate san Francisco, industrial real estate, san Francisco industrial real estate, industrial real estate san Francisco, warehouse san Francisco, commercial real estate news, industrial real estate news, industrial for lease, commercial real estate for lease, san Francisco commercial space for lease, san Francisco commercial office for lease, san Francisco warehouse for lease, san Francisco commercial broker, Commercial real estate, san Francisco commercial real estate, commercial real estate san Francisco, industrial real estate, san Francisco industrial real estate, industrial real estate san Francisco, warehouse san Francisco, commercial real estate news, industrial real estate news, industrial for lease, commercial real estate for lease, san Francisco commercial space for lease, san Francisco commercial office for lease, san Francisco warehouse for lease, san Francisco commercial broker

With Little Available Modern Space, Investors Scrambling for Bulk Warehouses in Second-Tier Markets, Ramping Up New Development

Source: CoStar
Reporter: Randyl Drummer
Date: February 5, 2015
Article Link: Warehouse Owners

Package shipper UPS isn’t the only one who loves logistics.

Property owners and investors are singing the praises of the unattractive but highly functional and in-demand property type after another quarter of strong rent growth and increasing demand for modern, bulk warehouse space in key distribution markets.

So much so in fact, that investor demand for warehouse and logistics properties is limited only by the current shortage of modern new buildings available to buy, according to CoStar analysts presenting their findings at the Fourth Quarter Industrial Real Estate Review and Outlook last week.

With rental rates on the rise, especially for new, high quality logistics space, “You can build and lease a building potentially for the next 10 years with a good credit tenant,” said Rene Circ, director of research, industrial for CoStar Portfolio Strategy. “This is as good a time in industrial real estate as you could possibly imagine, and we are seeing that in terms of questions from our clients and people wanting to get into the market.”

Co-presenter and senior real estate economist Shaw Lupton also noted that, despite the dearth of property available in the market, sales of institutional grade properties have never been stronger in terms of sales volume and square footage traded.

Capitalization rates are at a record low of below 6% for institutional properties, with reports of much lower cap rates for sales of big box warehouse leased to triple-net credit tenants in the best markets, Lupton said.

“It’s a great time to own industrial real estate, and it’s increasingly competitive to get into it,” Lupton said. Investment sales were up a solid 8% in the industrial sector in 2014 to $60 billion.

Despite the robust investor interest, industrial property sales still lagged multifamily, office and retail property sales, largely because there simply wasn’t enough buildings available to buy. Construction on new bulk warehouse space is ramping up, but it has yet to catch up with investor demand for the new modern facilities favored in tenants for their increasingly sophisticated and high-tech logistics supply chains.

CoStar analyzed the inventory of newer logistics buildings five years old or less compared with all existing logistics buildings and found that both the supply of newer buildings and the ratio of sales has dwindled significantly since 2002, when 32% of all trades were of buildings less than five years old. Today, the number is closer to 10%.

“New supply will be needed to raise the overall level of transaction value,” Circ said. “You can make the argument that lack of new construction is holding back sales by as much as 10 percentage points. Building (prices) are being bid up because there are just not enough sellers.”

While industrial real estate rarely outperforms other more glamorous property sectors, rents for industrial space, led by demand for newer, high-functioning properties, grew an average 4.5% for all industrial properties in 2014 over the previous year. That rate of increase outstripped the healthy 3.7% rental rate increase logged by the office market, 3.2% in the apartment sector, and the 3% rent growth in retail real estate.

The amount of available space on the market is tightening. The 8.7% vacancy rate for logistics space in the fourth quarter compares with a reading of 9.9% at the height of the last real estate cycle in 2007. Absorption totaled 167 million square feet in 2014, slightly lighter than the year before only because of the lack of usable vacant space, Lupton said.

“There just isn’t enough space out there to allow for [larger] numbers,” he said. “We’re not lagging much below the absorption peak, but to get beyond that, we absolutely need more new construction.”

While logistics construction was up 14% in 2014 to 136 million square feet, it’s still about 44 million square feet below the early 2000s peak of 180 million square feet.

While the recovery in rents and property values for high quality logistics space is nearly complete, Circ and Lupton noted that the light industrial property segment is still in the early expansion phase, with very little new construction, which is expected to change over the next few quarters.

“There’s still a lot of runway for growth in light industrial,” Circ said, adding that the improvement in this sector of the industrial real estate market is a very promising sign for the recovery of numerous local markets.

“These are not the big multinational companies, the Amazons, these are local businesses. We’re seeing the light industrial segment doing really well, which gives me a lot of comfort in the strength of local economies,” Circ said.

“When you see these local manufacturing and housing-oriented businesses taking space and making lease commitments, it means they have a lot more visibility into their business growing again, and that supports the guts of the local economy.”

2170 Cesar Chavez_Web

Commercial real estate, san Francisco commercial real estate, commercial real estate san Francisco, industrial real estate, san Francisco industrial real estate, industrial real estate san Francisco, warehouse san Francisco, commercial real estate news, industrial real estate news, industrial for lease, commercial real estate for lease, san Francisco commercial space for lease, san Francisco commercial office for lease, san Francisco warehouse for lease, san Francisco commercial broker, Commercial real estate, san Francisco commercial real estate, commercial real estate san Francisco, industrial real estate, san Francisco industrial real estate, industrial real estate san Francisco, warehouse san Francisco, commercial real estate news, industrial real estate news, industrial for lease, commercial real estate for lease, san Francisco commercial space for lease, san Francisco commercial office for lease, san Francisco warehouse for lease, san Francisco commercial broker>

The San Francisco Industrial market ended the fourth quarter 2014 with a vacancy rate of 3.9%. The vacancy rate was down over the previous quarter, with net absorption totaling positive 278,485 square feet in the fourth quarter. Vacant sublease space decreased in the quarter, end- ing the quarter at 285,144 square feet. Rental rates ended the fourth quarter at $15.94, an increase over the previous quarter. There was 108,080 square feet still under construction at the end of the quarter.

ABSORPTION
Net absorption for the overall San Francisco Industrial market was positive 278,485 square feet in the fourth quarter2014. That compares to negative (98,393) square feet in the third quarter 2014, positive 979,226 square feet in the second quarter 2014, and positive 106,799 square feet in the first quarter 2014.

Tenants moving out of large blocks of space in 2014 include: FedEx moving out of (60,100) square feet at 200 Littlefield Ave, Vitasoy moving out of (52,500) square feet at 584 Eccles Ave, and KaloBios Pharmaceuticals moving out of(49,351) square feet at 260 E Grand Ave.

The Flex building market recorded net absorption of positive 131,243 square feet in the fourth quarter 2014, compared to positive 38,309 square feet in the third quarter 2014, positive 299,408 in the second quarter 2014, and negative (33,399) in the first quarter 2014.

The Warehouse building market recorded net absorption of positive 147,242 square feet in the fourth quarter 2014 com- pared to negative (136,702) square feet in the third quarter 2014, positive 679,818 in the second quarter 2014, and positive 140,198 in the first quarter 2014.

VACANCY
The Industrial vacancy rate in the San Francisco market area decreased to 3.9% at the end of the fourth quarter 2014. The vacancy rate was 4.2% at the end of the third quarter 2014, 4.1% at the end of the second quarter 2014, and 5.7% at the end of the first quarter 2014.

Flex projects reported a vacancy rate of 5.3% at the end of the fourth quarter 2014, 5.8% at the end of the third quarter 2014, 6.0% at the end of the second quarter 2014, and 9.3% at the end of the first quarter 2014.

Warehouse projects reported a vacancy rate of 3.4% at the end of the fourth quarter 2014, 3.7% at the end of third quarter 2014, 3.5% at the end of the second quarter 2014, and 4.5% at the end of the first quarter 2014.

RENTAL RATES
The average quoted asking rental rate for available Industrial space was $15.94 per square foot per year at the end of the fourth quarter 2014 in the San Francisco market area. This represented a 4.4% increase in quoted rental rates from the end of the third quarter 2014, when rents were reported at $15.27 per square foot.

The average quoted rate within the Flex sector was $25.58 per square foot at the end of the fourth quarter 2014, while Warehouse rates stood at $12.05. At the end of the third quarter 2014, Flex rates were $24.68 per square foot, and Warehouse rates were $11.65.

DELIVERIES AND CONSTRUCTION
During the fourth quarter 2014, no new space was completed in the San Francisco market area. This compares to 0 buildings completed in the previous three quarters. There were 108,080 square feet of Industrial space under construction at the end of the fourth quarter 2014. The largest projects underway at the end of fourth quarter 2014 were 901 Rankin St, an 82,480-square-foot building with 100% of its space pre-leased by Goodeggs and Mollie Stone’s Markets, and 1 Kelly Ct, a 25,600-square-foot facility that CS Bio Company, Inc. expanded.

INVENTORY
Total Industrial inventory in the San Francisco market area amounted to 94,659,417 square feet in 4,843 buildings as of the end of the fourth quarter 2014. The Flex sector consisted of 23,849,302 square feet in 789 projects. The Warehouse sector consisted of 70,810,115 square feet in 4,054 buildings. Within the Industrial market there were 511 owner-occupied buildings accounting for 12,380,944 square feet of Industrial space.

SALES ACTIVITY
Tallying industrial building sales of 15,000 square feet or larger, San Francisco industrial sales figures fell during the third quarter 2014 in terms of dollar volume compared to the second quarter of 2014. In the third quarter, nine industrial transactions closed with a total volume of $83,684,000. The nine buildings totaled 377,408 square feet and the average price per square foot equated to $221.73 per square foot. That compares to 20 trans- actions totaling $109,016,000 in the second quarter. The total square footage was 558,793 for an average price per square foot of $195.09.


Total year-to-date industrial building sales activity in 2014 is up compared to the previous year. In the first nine months of 2014, the market saw 36 industrial sales transactions with a total volume of $346,298,100. The price per square foot has averaged $215.98 this year. In the first nine months of 2013, the market posted 19 transactions with a total volume of $107,082,100. The price per square foot averaged $166.89.

Cap rates have been higher in 2014, averaging 6.70%, compared to the first nine months of last year when they averaged 6.10%.

Source: CoStar Year End 2014 Industrial Report