Category: industrial real estate news san francisco (39)

Source: CoStar
By: Jesse Gundersheim

While some investors are exploring secondary and even tertiary markets throughout the country in search for higher yields, coastal gateway cities continue to take home the lion’s share of capital investment.

As typical, New York outpaces all other U.S. markets by far. Next up is Boston, then Los Angeles, Washington D.C. and Seattle. And while San Francisco and San Jose in California rank sixth and seventh, respectively, and the state’s East Bay rounds out the nation’s top 15, if all the Bay Area markets were combined they would outpace all but New York.

It’s further evidence of enduring demand generated by buyers attracted to the Bay Area’s expanding tech industry, along with several owner-user acquisitions, which has maintained downward pressure on capitalization rates, or the expected rate of return on investment, at premium asset pricing.

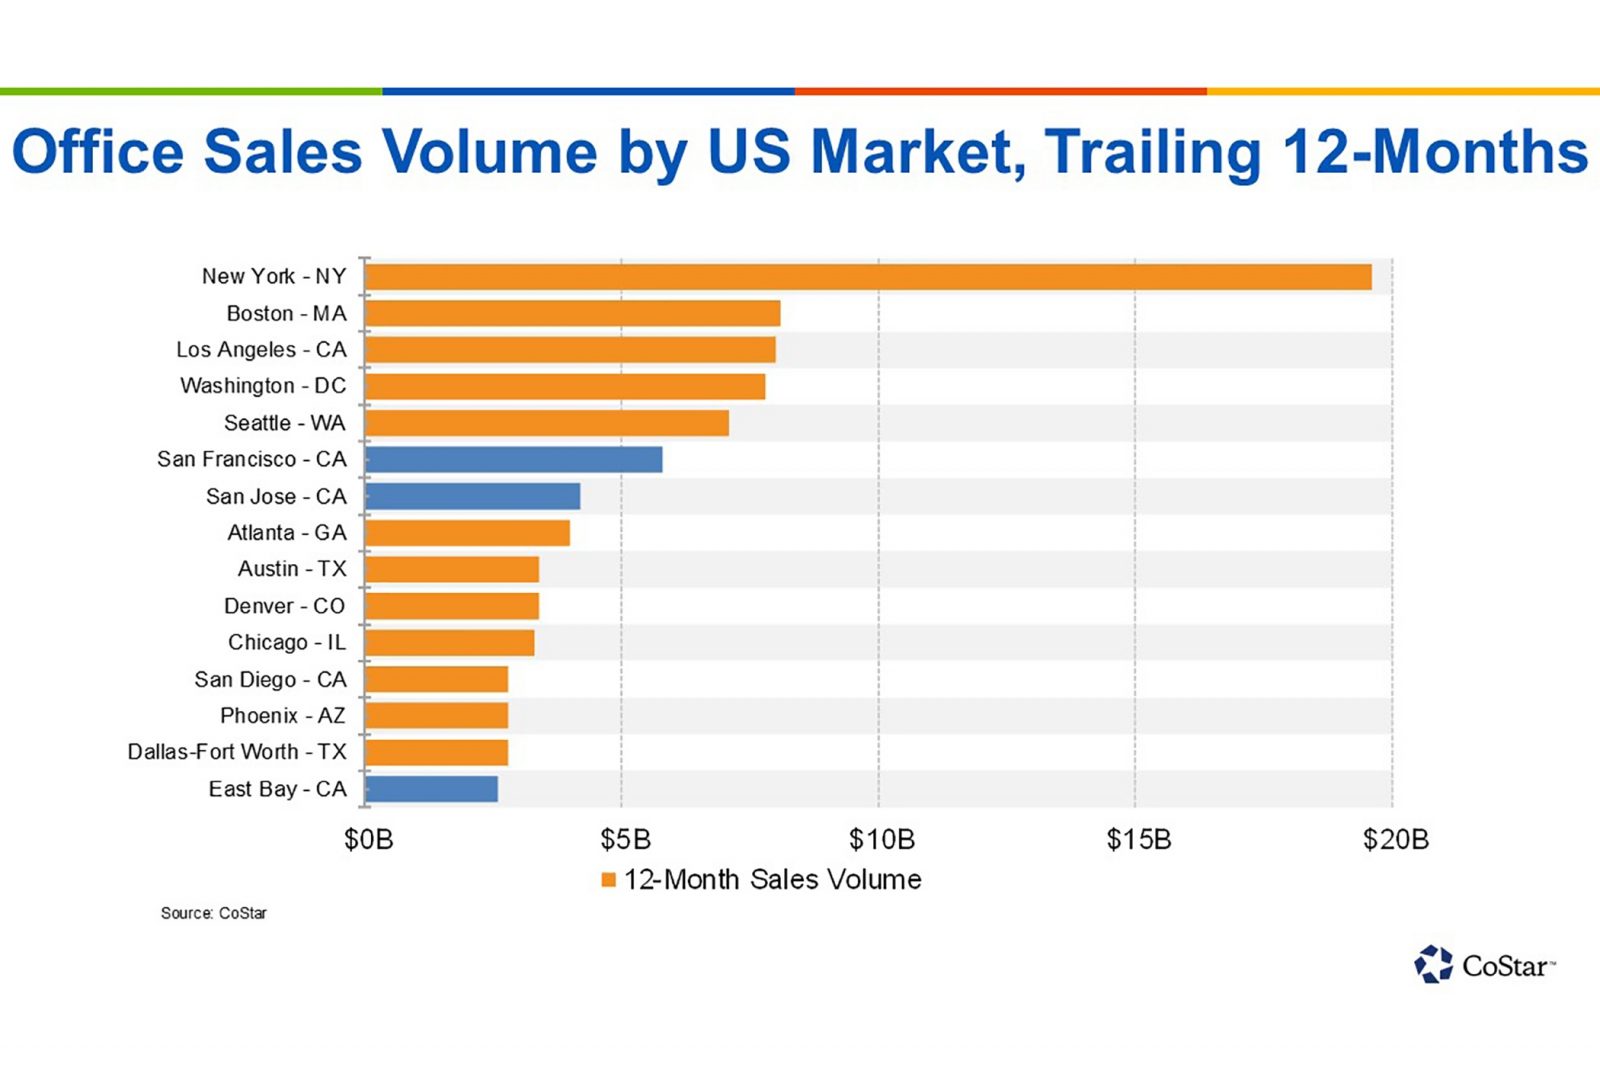
Combined, the three major Bay Area markets have seen $12.5 billion of office assets sell over the past 12 months, behind only New York’s $19.6 billion.

Sales volume in San Francisco alone, at $5.2 billion year to date, has already eclipsed the previous two year’s annual totals.

Boston, Los Angeles and Washington, D.C., have each seen about $8 billion in office assets trade over the past year.

Vacancy Rate Dips for Top Quality Space as Office Absorption Remains Well Ahead of New Construction

Source: CoStar
By: Randyl Drummer
Dated Posted: October 21, 2015

The U.S. office market logged 29 million square feet of net absorption in the third quarter, the second-highest quarterly total since 2006, with demand for office space from expanding companies roughly doubling the amount of new office supply added by developers.

The 68 million square feet of net office absorption in the first three quarters of 2015 compares with an average of just 30 million square feet during the same periods in 2005 through 2007, considered to be the height of the last office boom. Meanwhile, the national office vacancy rate continued its slow and steady decline, dipping to 11% for the third quarter of 2015, down another 20 basis points from midyear and a 60 basis point decline from third-quarter 2014.

shutterstock_270941090_for web

A large majority of U.S. office submarkets, 65%, saw declining office vacancy in the third quarter, while 52% of U.S. submarkets now have lower office vacancy than during the 2006-07 peak, with most metros posting solid rent growth.

Those were among the key findings in CoStar’s State of the U.S. Office Market Third Quarter 2015 Review and Forecast presentation this week, which aslo noted one major difference from previous office market cycles: the average vacancy rate for high-quality 4- and 5-Star office space built since 2008 has remained flat, even though the 42 million square feet of new supply delivered in the first three quarters is nearly 40% above the same period in 2005-2007, said Walter Page, CoStar Group, Inc. director of U.S. research, office.

Q315Office

“We’re at a rare point. Vacancy in new space has flat-lined since about 2013. What’s interesting about that is the supply pipeline has not caused the rate to spike up nationally, unlike other market cycles,” said Page, who was joined by Aaron Jodka, senior manager, market analytics and Managing Director Hans Nordby for the the office market analysis.

“Office tenants clearly want this new space and are willing to pay for it because obviously, they’re leasing it up,” Page added.

Jodka added that demand for 4-and 5-Star space grew at 2.5% between third-quarter 2014 and the most recent three-month period, compared with 1.4% in the overall office market and nearly three times the demand growth rate achieved for 1-, 2- and 3-Star properties.

Nordby noted that despite a rise in rental rates, total occupancy costs as a percentage of company profits remain at an all-time low as companies continue to put more workers into fewer square feet, which is allowing firms to continue leasing high-quality space.

Among individual markets, Dallas stood out by posting the strongest year-over-year net absorption, while Houston — plagued by space-givebacks among energy focused companies — saw the weakest demand among large U.S. metros. Perhaps due to a more diversified business base, Dallas-Fort Worth and Denver are thriving despite their exposure to the economic repercussions from the falling price of oil.

Nordby pointed out that Dallas and Atlanta are classic big-tenant markets that do well late in the economic cycle, with corporate relocations of companies that require large blocks of space driving their markets.

Link to article: US Office Demand

Calco Commercial represented the Buyer in the recent purchase of 111 S. Maple Avenue in South San Francisco. 111 South Maple Avenue consists of 27,360+/- square feet of commercial warehouse construction situated on a larger 1.25 acre lot. The warehouse boasts high ceilings, heavy power and close proximity to Highway 101, I-280, I-380 and SFO.

111_S_Maple

Calco Commercial has completed nearly 60 lease and sale transactions over the last year, representing approximately 450,000 square feet of commercial product. Calco continues to lead the San Francisco brokerage industrial marketplace. The Bay Area commercial properties continue to demand premium rental and sale rates as inventory and vacancies shrink.

Calco Commercial is a full service outfit that can help you make the most of your real estate properties and investments. If you would like to discuss your real estate options, or would simply like more information related to current market conditions, please call our office at 415.970.0000.

Boston Properties pitches 1.1 million-square-foot office addition to S.F. skyline
Source: San Francisco Business Times
By: Cory Weinberg
Dated Posted: September 29, 2015

Real estate giant Boston Properties, already building the tallest tower in San Francisco, has just proposed another huge addition to the skyline in South of Market.

The real estate investment trust filed preliminary plans for a 1.1-million-square-foot office complex that will sprawl on a full block across Fourth and Harrison Streets (across from Whole Foods). It will include a 240-foot-tall, carved-up tower that will likely become a future technology hub.

SF_Skyline_Web

“In a similar way we think about Salesforce Tower as a vertical campus, we think of this as an urban campus that will be attractive to large tech tenants,” said Michael Tymoff, senior project manager at Boston Properties. “We want the project to reflect the Centraol SoMa neighborhood, and have it not be a downtown office building or suburban office park from an architectural perspective.”

I reported in February that Boston Properties (NYSE: BXP) finalized a purchase option for the 102,000-square-foot lot that now houses a parking garage and a rundown auto repair shop. Boston is one of several big-time developers that have swarmed the Central SoMa area getting rezoned for more height and office use. The rezoning plan should get Board of Supervisors approved next year.

The plan’s preparation has triggered proposals from several major developers, like Kilroy Realty’s Flower Mart office complex, Tishman Speyer’s proposal of condominium towers that would raze the Creamery cafe, and Alexandria Real Estate Equities’ transformation of the decades-old S.F. Tennis Club into an office-fitness mixed-use project.

Boston Properties’ plan is not only one of the largest, but one of the most visually striking – love it, or hate it. A 65-foot podium building with a 90,000-square-foot floor plate will span the entire site. A 130-foot-tall midrise will stack on top on the eastern edge and a 240-foot tower on the western end.

“There aren’t many other buildings in the city that come close to 90,000-square-foot floor plate from a contiguous standpoint. It’ll stand out from the crowd,” Tymoff said.

Architect HOK (Hellmuth, Obata + Kassabaum) looked to “accentuate the ‘elegant and sculpted’ impression of the tower portion both as viewed from the neighborhood and distance along the skyline” with “sculpted buildings,” according to the plans.

“The various carvings into the tower result in a mass that resembles several individual buildings, rather than a single monolithic tower,” according to the plans.

In all, the project would include 907,300 square feet of office space, 9,900 square feet of retail and 53,6000 square feet of “flexible” space that will likely be zoned to open up more space for manufacturers or artists. It will also include about 15,600 square feet of public open space.

Of course, this project will likely shift at least slightly as the Central SoMa plan gets firmed up. The heights mostly conform with what the 2013 draft plan set as guidelines.

The Central SoMa rezoning would funnel an additional $600 million to $800 million into the city’s coffers from developers. The plan could also mandate that developers boost the amount of affordable housing and art and manufacturing space they build. The goal? Harness lucrative office development for more public good. (The trick, of course, is making sure that development is still financially viable even when San Francisco hits an inevitable economic skid.)

The project’s initial plans don’t go far enough in ensuring the neighborhood’s affordability, said SoMa activist John Elberling, who has been working with developers and the Planning Department to try to shape a “community plan.”

“We’ve proposed carving out an affordable housing site, about 15,000-square-feet, on (the site’s) east end. That’s not included,” he said. Elberling added that the building’s entire ground floor should be for affordable manufacturing or arts space, not just 50,000 square feet.

Another twist? The project may sit in a long line of development trying to nab the city’s finite office allocation, which is running out due to the 1986 office cap known as Proposition M. The mayor’s office has pitched some potential solutions to the pipeline clog, but hasn’t followed through on policy changes.

“We’re watching it close,” Tymoff said.

Link to article: Addition to SF Skyline

Source: San Francisco Business Times
By: Cory Weinberg
Date Posted: September 28, 2015

Surrounding the Anchor Steam Brewing Co. headquarters in Potrero Hill, the real-estate equivalent of a late-night bar brawl has been raging in the neighborhood.

Most major residential projects proposed for Potrero Hill are in the melee, but developer Related California is trying to rise above the fray a block from the brewery at 1601 Mariposa St. Related California sliced the number of rental units in its controversial Potrero Hill apartment proposal by 7 percent and boosted the percentage of affordable housing as it stares down a date with the Planning Commission next month.

The 1601 Mariposa proposal — two four-story buildings pitched three years ago to replace a warehouse and parking lots on the northern slope of Potrero Hill — shrunk its project from 320 units to 299 units after criticism from neighborhood groups that the apartment would crowd the neighboring Live Oaks private school.

renderings_aug15_02

The developer also set aside 20 percent of the project for people making about half of the city’s median income instead of the initial required 14 percent. The project includes 28,000 square feet of public open space, and the developer has mulled another increase in the number of three-bedroom units to draw more families to the neighborhood. To help ease traffic, the project will swap out some retail space for workspace that will house small manufacturers.

“I’m sure you could find 10 people to disagree with me, but we’ve had a lot of big meetings lately, and I think people really like the plan in general – those who aren’t just opposed to any density at all,” said Bill Witte, Related California’s president and CEO. “The question is – which isn’t unusual in San Francisco – which community benefits are you willing to agree to to make it more neighborhood friendly, more affordable?”

The project is slated to get a large project authorization from the Planning Commission on Oct. 22, which would mostly greenlight it for construction. (The threats of lawsuits could always slow things down, of course.)

It would be one of the largest built in the neighborhood in recent memory and is part of a string of dense development there, including the 395-unit 1200 17th St. and the 234-unit 1301 16th St.

The 1601 Mariposa project – designed by David Baker Architects – already mostly conformed with current zoning under 2009’s Eastern Neighborhoods Plan. A city environmental study found the project would have significant and unavoidable traffic impacts at just one of 13 intersections studied – Mariposa and Mississippi streets. Combined with other projects that are in the development queue, the intersection of 16th and Arkansas streets will also get squeezed. Muni congestion would be insignificant, the study found.

The problem is that Potrero Hill – along with neighboring Dogpatch– has seen a string of residential proposals that add badly needed housing to the city’s stock, but rankled neighbors who are starting to see heavy construction with little transit or park improvements to show for it. (The 1601 Mariposa development would pay about $4 million in fees for the city to acquire and upgrade city parks.)

A group opposed to 1601 Mariposa, called “Grow Potrero Responsibly,” has said that the project would further congest Muni, provide insufficient parking and would be too dense for the neighborhood. The site is also zoned “urban-mixed use,” a designation that allows for flexible use and has paved the way for housing to replace production, distribution and repair (PDR) businesses.

J.R. Eppler, who heads the Potrero Boosters neighborhood group, said he only had quibbles with the project and that much of the large differences had been resolved. The group will vote on endorsing the project Tuesday.

The census tracts surrounding the 1601 Mariposa project include median household incomes that are about double the city as a whole and that also have much higher home-ownership rates. The neighborhood is attractive to builders not only for its zoning but for its proximity to technology and biotech headquarters in South of Market and Mission Bay.

While few projects have been completed so far, the Potrero Hill/Showplace Square plan area includes 19 percent of the city’s total units approved for construction, according to the city’s Housing Inventory report.

Adding to the irritation, the Warriors arena proposal, Pier 70, and the Giants’ Mission Rock development are large projects that will sit nearby. (Those haven’t galvanized significant, organized opposition in Potrero Hill, however.)

The Planning Commission is due for a briefing on the Potrero Hill/Showplace Square plan area this Thursday. Meanwhile, developers fighting against a proposed moratorium on market-rate in the Mission District have feared a similarly drastic measure in Potrero Hill.

Eppler of the Potrero Boosters said neighbors aren’t mulling a moratorium but want the Planning Department to re-evaluate the Eastern Neighborhoods plan as it “reaches the end of the pipeline” of construction planned there.

“There needs to be the political will necessary to devote a significant amount of resources to Potrero Hill, Dogpatch, Mission Bay, South Beach and to connect dots of development to implement new systems that will allow them to operate together,” Eppler said.

link to article: Potrero Housing

Cash Flow, CRE Fundamentals Pose Strong Counter Punch to Potential Rate Increase Impact on CRE Values According to Accounting Firm
Source: CoStar News
By: Mark Heschmeyer
Reposted: September 16, 2015

As the Federal Reserve readies an expected decision this week on whether to begin raising interest rates, common assumptions among some commercial real estate investors, developers and lenders are that CRE values will take a hit when interest rates are raised.

The basis for this assumption appears intuitive at first. Rising benchmark interest rates, like Treasuries, should tend to make all yield-oriented investments to be less attractive,

However, according to a new report issued this week by accounting firm EY, the relationship between interest rates and CRE values is much more nuanced. While the Fed’s initial policy adjustments likely will have a marginal impact on CRE valuations and investment momentum, interest rates and cap rates aren’t always correlated, the EY report authors claim.

Several factors affect the trajectory of capitalization rates and real estate values, such as demand and supply changes, transaction activity and trends in the overall economy. An in the current market, CRE fundamentals are strong.

interest rate_forweb

At the worst, EY predicts, an uptick in the federal funds rate may make it more expensive to develop new projects and refinance certain debt, and possibly cause a reactionary sell-off in publicly traded real estate investment trusts (REITs).

However, as it currently stands, relative to historical averages over the last 30 years, the spread between the 10-year Treasury and CRE yields appears to allow for further compression. This suggests that CRE values are not immediately threatened by rising interest rates, EY said.

The EY report was authored by members of EY’s real estate M&A advisory team led by Steve Rado, a principal in Ernst & Young LLP’s Transaction Advisory Services practice, with contributing author Dr. W. Michael Cox, the former chief economist of the Dallas Federal Reserve Bank and a professor at Southern Methodist University’s Cox School of Business.

EY noted several drivers that are expected to buttress real estate values, including record amounts of inbound capital, available private equity ‘dry powder’ for investment, a generally positive economic outlook with some obvious caveats, and relatively strong CRE fundamentals.

A 25 to 50 BPS Jump Doesn’t a Spike Make

A shock to the U.S. CRE investment environment from a 25 to 50 bps increase in the overnight lending rate seems unlikely in light of the forecasted environment for the sector, according to EY. With vacancies trending down in office, retail and industrial properties and hospitality and multifamily exhibiting increased rents, the report’s authors expect the effect of contractionary monetary policy and rising interest rates on real estate values and cap rates to be mitigated in the near term, especially for investors focused on cash flows from higher lease rates and strengthened property operations.

While many observers purport a negative outlook for CRE based on the premise of a spike in long-term interest rates, the possibility that long-term interest rates will see only moderate increase over the near term is more likely given the slower pace of the U.S. economic recovery, the EY analysts said.

They also expect CRE will continue to be an attractive investment on a risk-adjusted basis in the near-term, given current conditions of increased capital supply and strong fundamentals, along with room for compression in the spread between cap rates and interest rates, according to the report.

However, EY cautioned investors on underwriting risk as trophy assets in gateway markets appear to be fully priced with new supply is coming on the market at a faster pace.

Finally, the EY report authors urged investors to see the glass as half-full rather than half-empty.

“Actions of the Fed to normalize interest rates should not be seen as a bane for the industry, but rather should instill confidence that their efforts are a proactive measure to provide stability in the future,” the EY report concluded.

Link to article: Interest Rates & CAP Rates

Despite Investor Concerns of Overheating, Market Indicators Support CRE Pricing
Re-posted: CoStar News
By: Randyl Drummer

As commercial real estate prices have continued to surge, some have become concerned that valuations may be overheating or even reaching bubble levels as a combination of high demand, low interest rates and loosening loan underwriting standards contribute to a record spike in deal activity and price paid per square foot for trophy properties in top U.S. and global markets.

But while investors and analysts agree the surging demand for commercial property should be closely scrutinized for signs of overheating, several market indicators appear to reflect solid justification for the upswing in prices. So while peaking prices are a concern, analysts said it is premature to characterize the recent valuation increases as a ‘bubble’ that will inevitably lead to a market correction.

shutterstock_270941090_for web

Rather, they said, the price increases seen over the past 12 months appear to be a direct function of the long period of low interest rates in a low-yield environment, coupled with strengthening fundamentals and rising property-income levels.

“Indicating that we are not in a bubble, we are still seeing a wide pricing gap for taking risk that did not exist in 2006 and 2007, when vacant buildings could fetch premium pricing because investors did not have to wait for leases to expire to get at the embedded rent growth,” said Walter Page, director of U.S. research, office, for CoStar Portfolio Strategy. “Capital is very risk adverse compared to 2007.”

Perhaps most significantly, Page added, previous pricing bubbles have burst only after developers flooded the market with a large supply of new space within a very short time. With the possible exception of the office construction boom in Houston, this is not the case today.

Showing a measure of caution following recent stock market volatility and swings in August and into September, property investors appear to be taking a pause to assess conditions, with previously acquisition-minded investors now saying, “Not so fast.”

In recent meetings with several major investors, Page said the discussions have changed tone and now focus on not rushing in and taking their time to place money. As a result, they expressed expectations that sales volumes may slow somewhat in the second half of 2015, Page said.

Price appreciation has also slowed, both from earlier this year and compared with the early to mid-recovery period from 2010 to 2013, suggesting that pricing is reaching market-clearing levels, added Page.

Using the term ‘bubble’ to describe the current pricing advances gives the false perception that the market is not stable and is ready to burst,” notes Andrew Nelson, chief economist for Colliers International.

“Investors like to buy closer to the bottom, and it certainly seems we’re closer to the top, even if not quite necessarily there,” Nelson said. “At the same time, market fundamentals are strong and getting stronger, and I do believe we have some time left on the clock in terms of continued economic growth.”

While the abundant supply of cash looking to find a home in U.S. properties is helping to propel sales, only about half of U.S. office markets are achieving pricing above the last peak, with top-tier markets like San Francisco, New York and San Jose leading the way. Other major world cities show a similar trend.

CoStar sales data shows record CRE sales volumes in all product types totaling $600 billion over the past four quarters, which is 7% above the 2007 record of $556 billion, and up by 23% from the four-quarter period a year earlier.

Office sales of $148 billion over the past four quarters trail the record $203 billion in 2007, which included $60 billion in sales and re-trading stemming from sale of Equity Office Properties to Blackstone, which some consider to mark the previous cycle’s peak. The current four-quarter sales volume represents a 21% increase from a year earlier, so clearly office sales volumes are strong, Page said.

However, the office value appreciation rate has slowed to 2.4% over the past year, down from the 5% to 8% appreciation rate between 2011 and 2013, Page said. Value increases over the past year have ranged from just over 4% in the San Francisco Bay area to less than 1% in Chicago, Seattle, and Denver.

A marked slowdown in cap rate compression, from 50 to 90 basis points per year during the 2010-2013 period to a 20 bps decline over the past year, also has contributed to the slowing depreciation.

“Because of the expectation of rising interest rates, we are forecasting that the current 5.7% national office cap rate will mark a market bottom, with a rise of 20 basis points forecasted by 2018,” Page said.

Valuations should increase in most markets for several more years, suggests that the growing strength of local economies will be a key factor in improving property returns, Page said.

“Our forecasted annual returns through 2019 range from over 9% for San Francisco and Nashville to 2% for Houston and Washington, D.C.”

Also, rent levels in a large number of metros have not yet risen to the point that justifies new office construction. With the exception of multifamily, levels of new supply remain moderate in most property types, particularly the office market, where construction is almost exactly at its long-term average of roughly 124 million square feet per year, well below the 184 million square feet added at the peak of the last market bubble, Page pointed out.

Moreover, the construction is highly concentrated in about one-third of U.S. markets, led by Houston and New York with 13 million square feet. Seattle, San Jose and San Francisco are also hot spots for office construction.

The remaining two-thirds of markets have roughly half their historical level of new office construction, yet the vacancy rates for these markets are about the same as in 2007.

Globally, property is expensive on a per-pound basis in some top markets, and cap rates are low for the best properties, typically signaling modest returns and expensive pricing, Colliers’ Nelson agrees. With inflation and interest rates still very low, however, spreads between cap rates and long-term Treasury note remain above their long-term averages, making pricing look much more reasonable, he added.

Link to article: Market Indicators Support CRE Pricing

CompStak:  San Francisco Office Rents Continue Their Rise
Re-posted from:  The Registry Bay Area Real Estate
By:  Robert Carlsen
Date Posted:  August 30, 2015

Many brokers, appraisers and developers have experienced San Francisco’s strong first half of the year in commercial real estate, with demand for office space continuing to outpace supply and office rents increasing across all building classes and submarkets.

While Class A and B buildings in San Francisco both had quiet starts to 2015, they recently picked up to close the first half of the year in the black, according to CompStak Exchange, a New York-based commercial real estate database specializing in lease comparables.

Market-Street_FOR-WEB

CompStak’s second quarter 2015 effective rent report said that Class A effective office rents in San Francisco were up 6.6 percent to $65.29 per square foot over the previous six months and Class B buildings performed even better, with effective rents increasing 12 percent to $59.40 per square foot over the same time period.

And with the tightness of available office space comes the absence of perks. “Landlords who also own property in markets outside of San Francisco know how favorable market conditions really are,” the report said. “Concessions given in San Francisco are far below comparable markets like Los Angeles, Manhattan and Washington, D.C.”

“For example, tenants in Washington, D.C., and Los Angeles County receive, on average, twice as much in free rent and tenant-improvement dollars. The strength of the San Francisco leasing market is evident when viewed in this light.”

According to Blake Toline, a CompStak research analyst, most of the demand driving up prices in San Francisco is coming from technology companies, which has been a trend over the past few quarters. The north and south Financial Districts typically have more corporate tenants, such as law, finance and consulting firms, “but that is starting to change as space around the city becomes harder to find, forcing tech tenants that wouldn’t have normally looked at the central business district to sign space there,” he said.

CompStak said that Class B buildings offer space with more character, unique interiors with exposed brick, operable windows and open floor plans, which makes them more attractive to tech tenants.

Toline provided some recent submarket tenant rent increases over the past six months.

In the lower South of Market area, Class B space is up 3.8 percent to $67 per square foot. Recent lease deals in the region include Elance at 475 Brannan St., which featured an 18,000-square-foot expansion, resulting in an effective rent in the mid-$70s; Hipmunk at 434 Brannan St., which included a 17,000-square-foot short-term renewal and saw effective rents in the high $60s; and HoneyBook at 539 Bryant St., which included a 15,000-square-foot rental in the low $70s.

In the south Financial District, Class A space is up 3.5 percent to $69.80 per square foot. Recent lease deals include WeMo Technologies at 555 Market St., which rented 172,000 square feet in the high $60s; Instacart at 50 Beale St. has 56,000 square feet of lease space in the high $60s; and Intercom at 55 2nd St. has 23,000 square feet of space in the mid-$70s range.

Additionally, in the north Financial District, Class A space is up 5 percent to $65 per square foot. Recent deals include a Sheppard Mullin Richter renewal at 4 Embarcadero, with 72,000 square feet of space in the high $70s; Sentient Technologies at 1 California St., with 17,000 square feet going for the low $70s; and HIG Capital at 1 Sansome, with its 11,000 square feet priced in the low $70s.

Link to article: SF Office Rents Continue Their Rise

But in Current Competitive Environment, Other Banks Still Cutting Deals
Source: CoStar
By: Mark Heschmeyer
Posted: July 29, 2015

Even though the Fed today signaled that it remains on course to raise interest rates in September or later this year, a few banks have already begun raising interest pricing on their commercial real estate loans, particularly for multifamily property. While long expected given the overall strength of the economy, the bump in pricing is coming weeks in advance of an expected hike in the Federal Reserve Bank lending rate.

“We’ve seen rates increase, both on the Treasuries and on swaps, and we’ve seen the increase being sustained and we’ve been wanting to raise interest rates for the last several weeks,” said Joseph DePaolo, president and CEO of Signature Bank.

However, DePaolo said his bank wasn’t able to raise rates in the second quarter because their competition wasn’t moving.

“You can’t be a half or more [percentage points] higher because no matter how much they want you and no matter how efficient our commercial real estate team is, half is a half, and it means a lot,” he said, noting the highly competitive lending environment.

But that has changed in the last 10 days.

“We did some due diligence last week and again yesterday (July 20) and found that our competitors were raising their five-year fixed from let’s say as low as 3% to 3.25%,” DePaolo said. “We were 3% and we simply raised ours to 3.5% and that was yesterday.”

While all the signs appear to point to interest rates finally moving up after many previous fals starts, not everyone is convinced that higher rates will finally take hold.

“That’s possible, but there’s no guarantee,” said Peter Ho, chairman, president and CEO of Bank of Hawaii. “We have seen these [trends] in the past, where it sure looks like rates are moving up and margins stabilized only to find out that, it’s not really a trend, it’s an aberration. So it’s definitely possible, but as I said, I just can’t guarantee that.”

With the expected change in rates, Stephen Gordon, chairman, president and CEO of Opus Bank in Irvine, CA, said his bank has been cutting back on multifamily lending, reducing its multifamily loans in its portfolio from 59% of its holdings to 53% this past quarter.

However, while certain banks have begun the shift to more costly money, the improving economy has banks competing intensely for borrowers as they return to market. As a result, aggressive competition for commercial real estate lending is continuing across much of the country.

“In my opinion [lending competition] remains brutal,” said Mark Hoppe, president, CEO of MB Financial Bank in Chicago.

That is particularly true in CRE lending, Hoppe noted. Loan to values are clearly going up and the bank is seeing more relaxation in the amount of guarantees required in some deals.

“We understand that this is the world we live in, a very competitive one, and we’re going to compete on every front but do it where we think it makes sense,” Hoppe said.

CRE Borrowing Moving Beyond Major Metros

René Jones, chief financial officer of M&T Bank, noted a significant shift in CRE lending patterns. In previous quarters, most of the lending growth in M&T’s markets were primarily around the New York City metro area. That’s not the case this past quarter.

“Right now, growth is everywhere,” Jones said.

Total loans in upstate and western New York, were up 4%. In metropolitan New York and Philadelphia, up 8%; in Pennsylvania, up 12%; in Baltimore, up 7%; and in its other regions, loan growth went up 5%.

Other CRE lending trends noted among the nation’s major banks emerged from mid-year earnings conference calls. Highlights follow:

The Eyes on Texas

“The Eyes of Texas” is the school spirit song of the University of Texas at Austin and the University of Texas at El Paso, but from an economic and CRE standpoint all eyes have been on just Houston for the last three quarters. With energy prices not rebounding much from their 2014 collapse, there has been a lot of concern about how Houston multifamily and office properties will hold up.

Although lenders are seeing some softness in the market, second quarter results appear to be muted.

“Our office construction portfolio is very modest in size. And the office term loan portfolio is performing well there,” said Scott J. McLean, president and COO of Zions Bancorp in Salt Lake City. “On the multifamily piece, we’ve had about five, six multifamily transactions that have come out of the construction period and they’re achieving rents that are actually above the pro formas. But clearly, there will be softness there for office and there will be softness in multifamily, but we think our real estate portfolio is about $1.5 billion less going into this downturn than it was going into the 2009 downturn,” McLean said.

However, McLean likes the overall direction of the Houston economy. While job growth won’t be the 80,000 to 100,000 new jobs it has averaged over the last couple of years, McLean said the market could see 10,000 to 20,000 new jobs this year and about 30,000 new housing starts.

“Sure Houston continues to be a dynamic market,” said Keith Cargill, president, CEO of Texas Capital Bancshares, but “there is no change in our view that we will see muted growth in CRE.”

“We know we are early relative to what appears to be still a very healthy market really in all categories. Our multifamily is still extremely strong. Even in our Houston market where we have some projects, I had some concern about six or eight months ago. They are holding up quite nicely and as they complete they seem to be hitting pro forma rates or better. And so we hope that continues,” Cargill said.

“We just believe strongly that you can have too much of a good thing in terms of concentration risk,” he added. “And while today [CRE, building and energy] are three of the healthiest businesses we have, they have more cyclical risk in a down cycle. And that’s the only reason that we are tamping down the growth rate.”

Lending for the Long-Term, Borrowing for the Short-Term

Rapidly escalating CRE prices are a mixed bag for banks. On the one hand, they create demand for loans. Banks are pricing those loans based generally on 10-year payback periods. But with the run-up in CRE values stretching into its fifth year, borrowers are flipping investments much more quickly than that.

Loan prepays are definitely on the high side, said Russ Colombo, president and CEO Bank of Marin in Marin County, CA.

“There is a fair amount of profit-taking going on,” Colombo said.

Link to article: Fed Move

At Midyear, Accelerating New Office Supply Held In Check By Strong Absorption
U.S. Office Market Reaches Supply-Demand ‘Sweet Spot’ as Tenants Trade Up to Higher-Quality Space Despite Rising Rents
Source: CoStar
Reporter: Randyl Drummer
Posted: June 22, 2015

U.S. office market demand growth rebounded in the second quarter of 2015 following slower-than-expected net absorption in the first three months of the year as businesses continued to add office jobs and lease space.

Net absorption roared to 25 million square feet in the second quarter, the second-highest quarter for demand growth since 2006 and more than double the 12 million square feet absorbed during the first quarter.

After years of slow and steady increase in office supply, the level of office space under construction reached 124 million square feet in the second quarter, the highest total since 2009 and slightly eclipsing the 15-year average of 122 million square feet.

Rent growth reached s 4% annual rate in the first half of 2015, while the national office vacancy rate declined 20 basis points to 11.2%. The 27 million square feet of new office space deliveries in the first half of 2015 exceeded the historical first-half average of 21 million square feet, reflecting a relatively healthy office market and broader economy.

“We’re at a supply/demand balance — a really sweet spot in the market cycle for the office market,” said Walter Page, CoStar Group, Inc. director of U.S. research, office, joined by Senior Manager, Market Analytics Aaron Jodka and Managing Director Hans Nordby for CoStar’s State of the U.S. Office Market Midyear 2015 Review and Forecast.

Q2Absorption

Link to Article: Highest Q2 Office Net Absorption in 7 Years