Category: CRE News San Francisco (3)

Source: CoStar News
By: Mark Heschmeyer
Date Posted: November 16, 2016

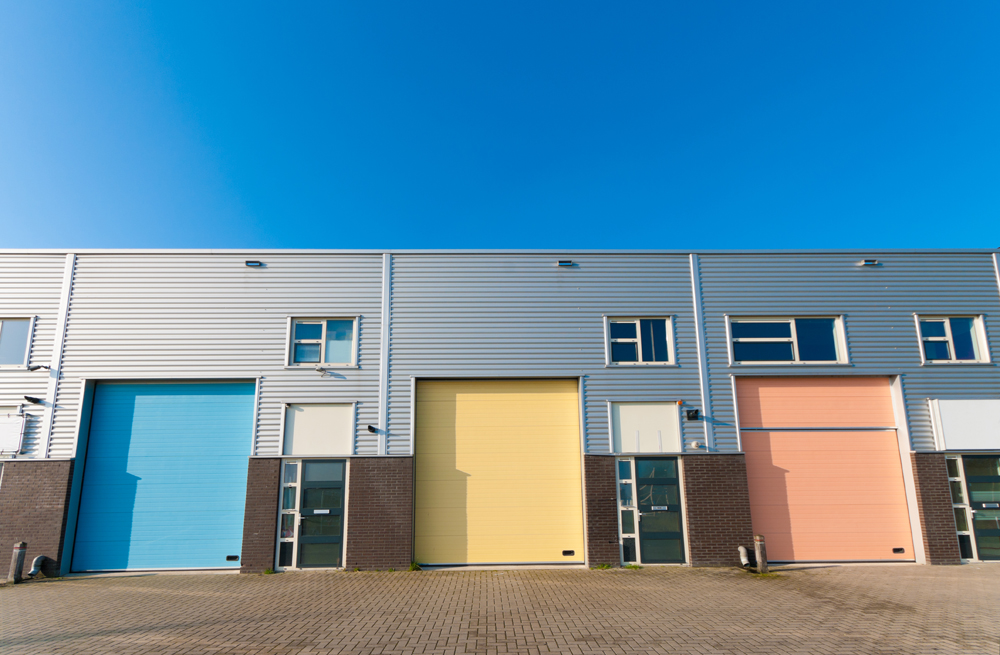
One group of business owners hasn’t benefitted from the rebound in property prices. Once a real estate mainstay, owner/user purchases of commercial properties by small businesses have declined over the first three quarters of this year, reversing four straight years of increasing sales, CoStar Comps data shows.
small_warehouse_business

Through the first three quarters of this year, owner/user purchases of office, industrial and retail properties ranged from $150,000 to $1.5 million and totaled $8.79 billion. That is down 11% for the same period last year.

By way of comparison, owner/user purchases of properties of more than $1.5 million are ahead of last year’s pace: $20.76 billion for the first three quarters of this year vs. $19.7 billion for the same period last year, which marked a post-recession high.

Higher property prices may be to blame. Property prices in the small business category have been skyrocketing from a low in 2012 of $51.46 per square foot. At the end of September 2016, the average price per square foot for this category had climbed 28% to $66.08 per square foot, fast approaching the 2009 average price peak of nearly $69 per square foot.

By property type, office properties sold in the $150,000 to $1.5 million price range bought by owner/users climbed from an average of $91.12 per square foot in 2012 to $98.61 per square foot at the end of the third quarter of 2016.

Retail prices for such properties bottomed in 2013 at $85.41 per square square foot and are now selling for more than office properties at an average of $99 per square foot.

Prices for industrial properties in the same price range have climbed from an average of $32 per square foot to $42 per square foot for the same period.

At the same time, banks have been cutting back on their real estate lending to small businesses.

Bank lending to small businesses secured by non-residential properties peaked in June 2008. Banks had more than 1.2 million such loans ranging from $100,000 to $1 million on their books at that time totaling $346.6 billion, according to data from the Federal Deposit Insurance Corp. That total had fallen 22% to $271.3 billion at the end of June 2016, the latest data available.

As an interesting side note though, banks make up five of the largest six sellers of properties to small business owner/users in the last two years. Wells Fargo accounted for about $37 million in such sales; PNC Financial Services, $26 million; Fifth Third Bank, $18.5 million; SunTrust Banks, $16.4 million; and Bank of America, $13.5 million, according to CoStar data.

Meanwhile, capital outlays by small businesses has been trending down, according to the National Federation of Independent Businesses, a small business trade group. The percentage of owners surveyed monthly making an outlay peaked for this recovery in July 2015 at 61% and held close to that through January 2016 but has faded since, according to NFIB’s October data.

The percent of owners planning capital outlays in the next three to six months was 27%, an historically weak number. Seasonally adjusted, the net percent expecting better business conditions fell 7 percentage points to a net negative 7%, which means that now, more owners expect that conditions will worsen. Only 9% of small business owners thought that now is a good time to expand.

Link to full article: CoStar-Small Business Lending Decline

Prop C–a controversial ballot measure that would require new housing developments to increase their “affordable housing” units from 12% to 25% has been passed by San Francisco voters.

What does this mean for the future of residential developments in San Francisco?

According to The San Francisco Business Times, developers and those groups opposed to the measure argue that additional requirements under Prop C will slow development and make housing more expensive, while supporters believe the measure will bring much needed affordable housing to a city where 64% of the population rents (source: Bay Area Census).

City Hall_WEB

San Francisco’s Office Vacancy Decreases to 6.8%

The San Francisco Office market ended the first quarter 2016 with a vacancy rate of 6.8%. The vacancy rate was down over the previous quarter, with net absorption totaling positive 887,196 square feet in the first quarter. Vacant sublease space increased in the quarter, ending the quarter at 1,412,643 square feet. Rental rates ended the first quarter at $52.43, an increase over the previous quarter. A total of two buildings delivered to the market in the quarter totaling 480,000 square feet, with 5,352,288 square feet still under construction at the end of the quarter.

Absorption
Net absorption for the overall San Francisco office market was positive 887,196 square feet in the first quarter 2016. That compares to positive 680,988 square feet in the fourth quarter
2015, negative (297,950) square feet in the third quarter 2015, and positive 1,332,620 square feet in the second quarter 2015.

The Class-A office market recorded net absorption of positive 669,332 square feet in the first quarter 2016, compared to positive 689,681 square feet in the fourth quarter 2015, negative (25,939) in the third quarter 2015, and positive 825,531 in the second quarter 2015.

The Class-B office market recorded net absorption of positive 248,697 square feet in the first quarter 2016, com- pared to negative (39,232) square feet in the fourth quarter
2015, negative (216,768) in the third quarter 2015, and positive 555,278 in the second quarter 2015.

The Class-C office market recorded net absorption of negative (30,833) square feet in the first quarter 2016 com- pared to positive 30,539 square feet in the fourth quarter
2015, negative (55,243) in the third quarter 2015, and negative (48,189) in the second quarter 2015.

Net absorption for San Francisco’s central business district was positive 660,981 square feet in the first quarter 2016. That compares to positive 163,176 square feet in the fourth quarter
2015, negative (267,529) in the third quarter 2015, and positive 387,476 in the second quarter 2015.

Net absorption for the suburban markets was positive 226,215 square feet in the first quarter 2016. That compares to positive 517,812 square feet in fourth quarter 2015, negative (30,421) in the third quarter 2015, and positive 945,144 in the second quarter 2015.

Vacancy
The office vacancy rate in the San Francisco market area decreased to 6.8% at the end of the first quarter 2016. The vacancy rate was 7.0% at the end of the fourth quarter 2015,
6.6% at the end of the third quarter 2015, and 6.4% at the end of the second quarter 2015.

1stQTR Office Vacancy Graph

Class-A projects reported a vacancy rate of 7.7% at the end of the first quarter 2016, 8.0% at the end of the fourth quarter 2015, remained the same at 7.4% at the end of the third quarter 2015 compared to the previous quarter.

Class-B projects reported a vacancy rate of 6.7% at the end of the first quarter 2016, 7.1% at the end of the fourth quarter 2015, 6.7% at the end of the third quarter 2015, and
6.3% at the end of the second quarter 2015.

Class-C projects reported a vacancy rate of 3.8% at the end of the first quarter 2016, 3.7% at the end of fourth quarter 2015, 3.9% at the end of the third quarter 2015, and 3.6% at the end of the second quarter 2015.

The overall vacancy rate in San Francisco’s central business district at the end of the first quarter 2016 decreased to 6.3%. The vacancy rate was 7.0% at the end of the fourth quarter 2015, 6.0% at the end of the third quarter 2015, and 5.8% at the end of the second quarter 2015.

The vacancy rate in the suburban markets increased to 7.5% in the first quarter 2016. The vacancy rate was 7.1% at the end of the fourth quarter 2015, 7.5% at the end of the third quarter 2015, and 7.4% at the end of the second quarter 2015.

Sublease Vacancy
The amount of vacant sublease space in the San Francisco market increased to 1,412,643 square feet by the end of the first quarter 2016, from 1,352,132 square feet at the end of the fourth quarter 2015. There was 1,275,923 square feet vacant at the end of the third quarter 2015 and 1,102,001 square feet at the end of the second quarter 2015.

San Francisco’s Class-A projects reported vacant sublease space of 998,469 square feet at the end of first quarter 2016, up from the 967,996 square feet reported at the end of the fourth quarter 2015. There were 857,982 square feet of sub- lease space vacant at the end of the third quarter 2015, and 748,203 square feet at the end of the second quarter 2015.

Class-B projects reported vacant sublease space of 333,325 square feet at the end of the first quarter 2016, up from the 329,958 square feet reported at the end of the fourth quarter 2015. At the end of the third quarter 2015 there were 342,020 square feet, and at the end of the second quarter 2015 there were 298,324 square feet vacant.

Class-C projects reported increased vacant sublease space from the fourth quarter 2015 to the first quarter 2016. Sublease vacancy went from 54,178 square feet to 80,849 square feet during that time. There was 75,921 square feet at the end of the third quarter 2015, and 55,474 square feet at the end of the second quarter 2015.

Sublease vacancy in San Francisco’s central business district stood at 673,271 square feet at the end of the first quarter 2016. It was 595,812 square feet at the end of the fourth quar- ter 2015, 543,796 square feet at the end of the third quarter 2015, and 491,777 square feet at the end of the second quarter 2015.

Sublease vacancy in the suburban markets ended the first quarter 2016 at 739,372 square feet. At the end of the fourth quarter 2015 sublease vacancy was 756,320 square feet, was 732,127 square feet at the end of the third quarter 2015, and was 610,224 square feet at the end of the second quarter
2015.

Rental Rates
The average quoted asking rental rate for available office space, all classes, was $52.43 per square foot per year at the end of the first quarter 2016 in the San Francisco market area. This represented a 1.1% increase in quoted rental rates from the end of the fourth quarter 2015, when rents were reported at
$51.84 per square foot.

The average quoted rate within the Class-A sector was $54.11 at the end of the first quarter 2016, while Class-B rates stood at $51.77, and Class-C rates at $46.73. At the end of the fourth quarter 2015, Class-A rates were $53.77 per square foot, Class-B rates were $50.94, and Class-C rates were $45.57.

The average quoted asking rental rate in San Francisco’s CBD was $57.99 at the end of the first quarter 2016, and $50.36 in the suburban markets. In the fourth quarter 2015, quoted rates were $58.19 in the CBD and $49.47 in the suburbs.

Inventory
Total office inventory in the San Francisco market area amounted to 165,448,464 square feet in 3,843 buildings as of the end of the first quarter 2016. The Class-A office sector consisted of 77,319,980 square feet in 304 projects. There were 1,437 Class-B buildings totaling 64,146,043 square feet, and the Class-C sector consisted of 23,982,441 square feet in 2,102 buildings. Within the Office market there were 209 owner- occupied buildings accounting for 18,858,040 square feet of office space.

Sales Activity
Tallying office building sales of 15,000 square feet or larger, San Francisco office sales figures fell during the fourth quarter 2015 in terms of dollar volume compared to the third quarter of 2015.

In the fourth quarter, 14 office transactions closed with a total volume of $1,043,890,500. The 14 buildings totaled 1,634,104 square feet and the average price per square foot equated to $638.82 per square foot. That compares to 13 transactions totaling $1,955,263,000 in the third quarter 2015. The total square footage in the third quarter was 2,904,410 square feet for an average price per square foot of $673.20.

Total office building sales activity in 2015 was down com- pared to 2014. In the twelve months of 2015, the market saw 48 office sales transactions with a total volume of $4,814,873,500. The price per square foot averaged $651.62. In the same twelve months of 2014, the market posted 76 transactions with a total volume of $6,456,094,000. The price per square foot averaged
$544.50.

Cap rates have been lower in 2015, averaging 4.76% compared to the same period in 2014 when they averaged 4.88%. One of the largest transactions that occurred within the last four quarters in the San Francisco market is the sale of 333 Bush St in San Francisco. This 546,182-square-foot office building sold for $378,500,000, or $692.99 per square foot. The property sold on 12/24/2015, at a 3.70% cap rate.

source: CoStar 1st Quarter 2016 San Francisco Office Market Report