Category: San Francisco Commercial Real Estate Tips (103)

Source: CoStar News
By: Lou Hirsh
February 11, 2020

A new list of the federal government’s surplus properties targeted for disposal includes what brokers say is real estate that’s expected to be in high demand by developers of offices and housing in some posh West Coast locales where land is tight.

What’s more, the decades-old properties — most of them underused offices — could be revamped for new uses, ranging from distribution centers to high-end apartments, retail and other mixed-use combinations that could bring new life to the areas, brokers and analysts say.

On the list, which contains 12 underutilized properties nationwide that could bring in more than $750 million, is real estate in areas where development and business have been growing from Seattle to Silicon Valley. It includes an entire city block just three miles from Facebook’s headquarters in Menlo Park, California, that could soon be for sale.

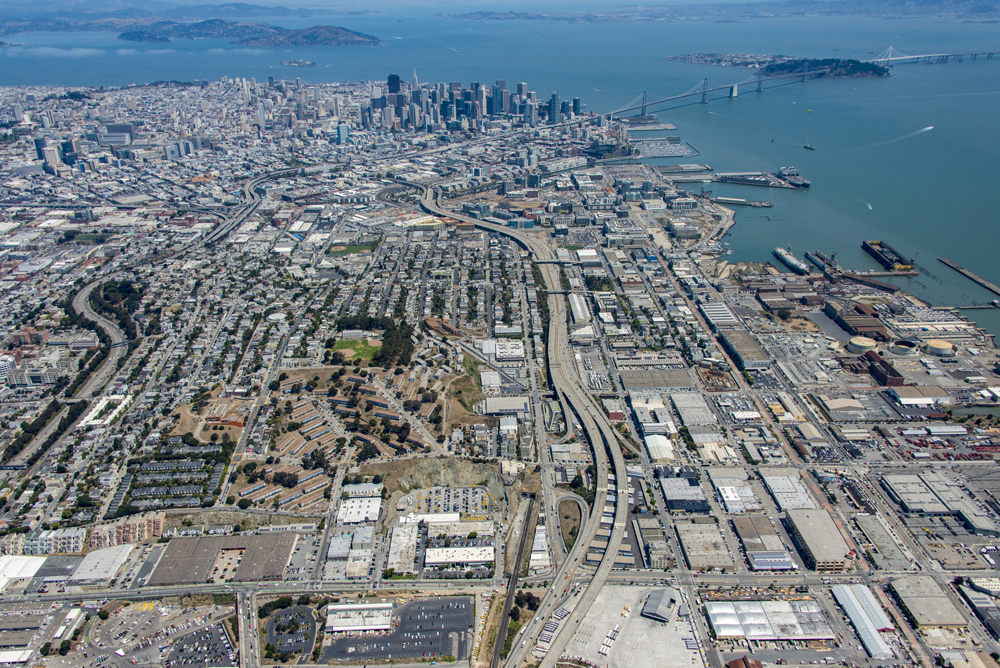
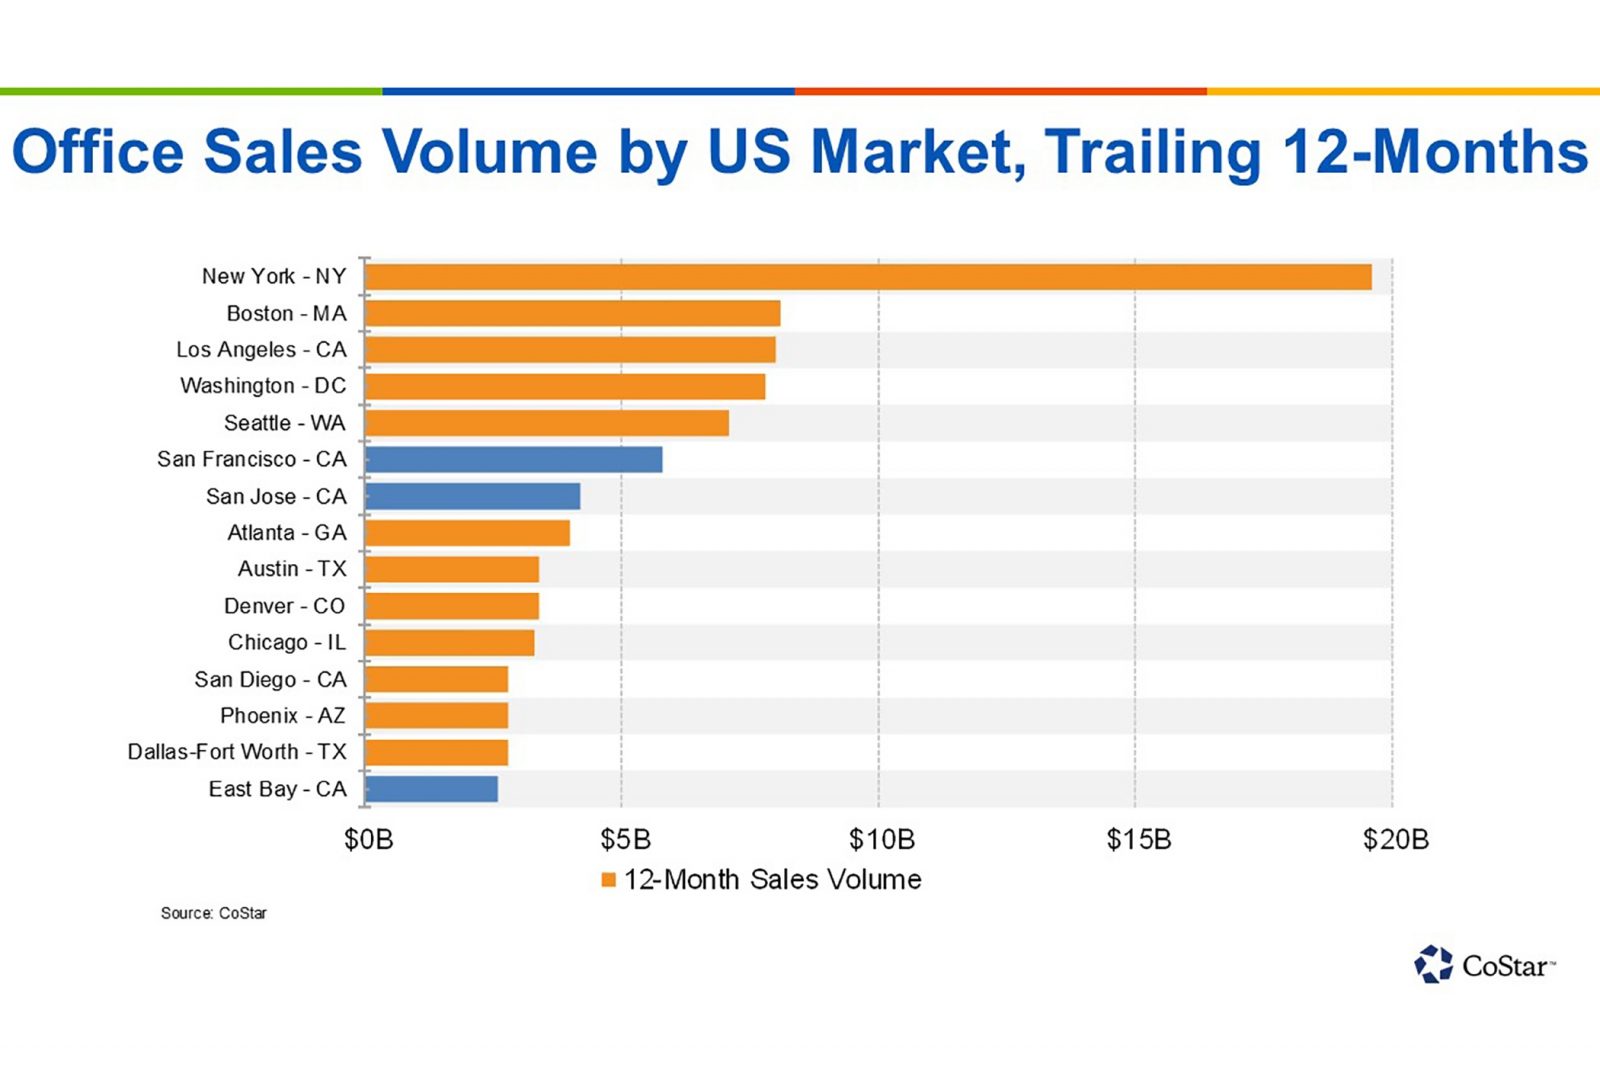
“The Menlo Park property is located in one of the country’s strongest markets for tenant demand,” said Jesse Gundersheim, CoStar Group’s director of market analytics in the San Francisco Bay Area. “Sales activity in Silicon Valley and San Francisco is robust, and cap rates remain at historic lows which is indicative of strong investment interest.”

The surplus property list put forward last month by a federal advisory panel stems from a bipartisan 2016 law requiring the Office of Management and Budget and General Services Administration to identify opportunities for the federal government to reduce its inventory of nonmilitary properties. The list is just the first round of potential sell-offs, with more rounds of recommendations expected in coming months, as the government looks to consolidate locations, maximize property values and revenue and trim down a real estate portfolio that includes roughly 77,000 underutilized properties.

Some that aren’t in their city’s downtown or prime office district could face the bulldozer, as developers put the land underneath them to more suitable uses demanded by the market, such as apartments and single-family homes — provided their projects get the blessing of local governments.

Take for instance the property at 1352 Lighthouse Ave. in coastal Pacific Grove, on the northern tip of central California’s Monterey Peninsula. The property, that CoStar data says was built in 1952 and spans 11,220 square feet on 4.4 acres, is a Department of Commerce fisheries science center.

Located just 5 miles north of the famed Pebble Beach Golf Course overlooking the Pacific Ocean, that federal facility sits in a city where the median home value is $902,528 and the median monthly apartment rent is $3,300, according to data firm Zillow.

“That location could be very sought-after for high-end housing,” said Cale Miller, senior vice president in the San Francisco office of commercial brokerage Hughes Marino, noting the neighborhood currently hosting the fisheries center is generally not known for offices or other heavy commercial uses.

The same generally goes for the 1 million-square-foot Chet Holifield Federal Building, built in 1971 at 24000 Avila Rd., about 8 miles from the Pacific Ocean in coastal Laguna Niguel. That city, in Southern California’s Orange County, has a median home value of $844,539 and median rent of $3,300, both well above regional averages.

Miller said housing or other mixed-use elements serving that neighborhood — rather than offices — would probably see the most practical demand going forward.

Coveted Silicon Valley

At the other end of the spectrum, brokers are expecting the listed property in Silicon Valley’s Menlo Park to see the greatest future demand on the office side. Washington, D.C., attorney David Winstead, who serves on the federal building advisory board, recently told CoStar News that the city block surrounding the Menlo Park Complex at 345 Middlefield Road “could be worth hundreds of millions of dollars.”

With multiple major tech firms expanding their office footprints in the supply-constrained region, the location is a major draw. The Menlo Park federal complex, housing the operations of the U.S. Geological Survey among other tenants and spanning just more than 140,000 square feet, is 3 miles south of Facebook’s global headquarters and even closer to local office strongholds of companies such as Apple and Hewlett Packard.

“Menlo Park has been ground zero for tech expansion,” said Eric Luhrs, regional president in the San Jose office of brokerage Kidder Mathews. “That’s still a very strong market, and that’s a great location as well.”

Luhrs said he’s expecting the Menlo Park location to garner serious interest from multiple developers and future tenants, including the venture and financial firms that have thrived in Silicon Valley. It could also attract smaller nontechnology firms that have found it tough to find new space as the major tech giants, including Facebook and Google, have expanded throughout the region.

Gundersheim noted that, based on its size, more than a million square feet on a 100-acre lot, the Laguna Nigel property could prove more valuable on a pure sales-price basis than the Menlo Park site. However, the Menlo location could represent a rare investment opportunity slightly east of that city’s most active section, the downtown area where most developers are now focused on revitalization.

In Menlo and other office locations, Luhrs said changeovers to commercial uses will depend on how the government chooses to transition out of them — for instance, whether the GSA sells buildings and immediately clears out the agencies that occupy them or chooses to stay in them for a period under leaseback arrangements with the buyer.

In the Seattle area, where older federal buildings on the list are not located in what are currently deemed the hot office markets, other types of nonresidential buyers and tenants could still find strategic uses for the properties.

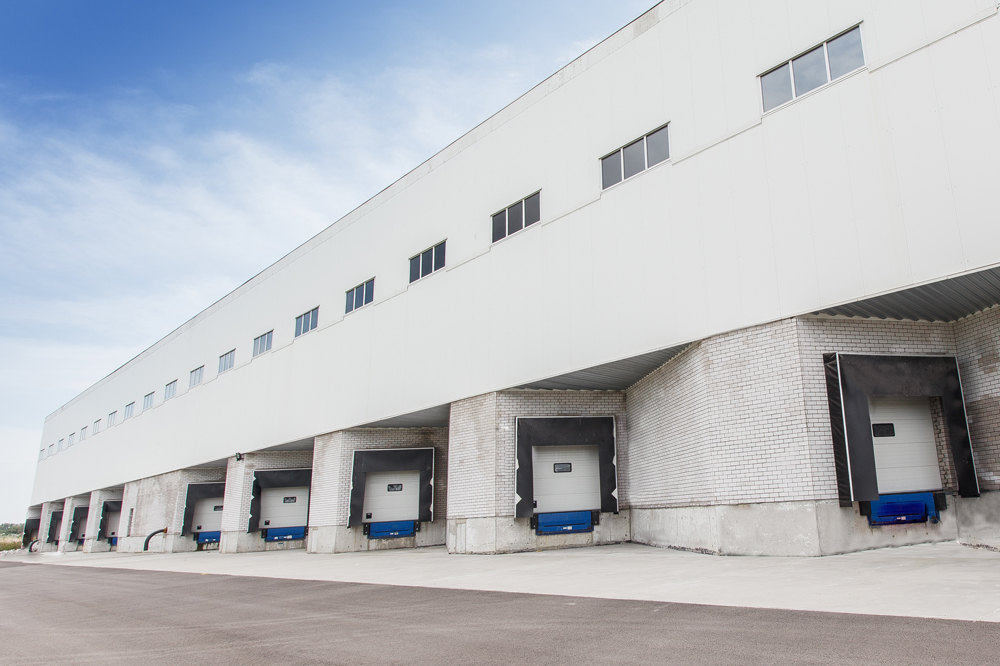
That includes the property currently known as the Federal Archives and Records Center, operated by the National Archives and Records Administration at 6125 Sand Point Way NE. The warehouse and office building was completed in 1945, spanning 184,251 square feet on 10 acres.

Owen Rice, executive vice president in Hughes Marino’s Seattle office, noted the area that grew up around that Seattle facility over the decades is primarily a residential neighborhood, known as Hawthorne Hills.

“That area has not really been a big hub for commercial offices in terms of demand,” Rice said. “It’s also a very constrained market in terms of supply.”

Alternate Seattle Scenarios

He said possible future nonresidential users of that government complex could include those in the fast-expanding healthcare industry. For instance, Seattle Children’s Hospital has existing operations next door to the Sand Point Way property and is known locally to be scouting sites for future expansion.

Rice said another vintage property on the federal list in Washington state, a government complex at 400 15th St. SW in Auburn, is located in an area just north of Tacoma that has become a popular regional hub for mostly small to mid-size industrial developers and tenants.

He said the 119,000-square-foot property, built in 1950 and last renovated in 2006, has good access to area ports and freeways but is in an area of the Kent Valley that has so far not become a hotbed for office expansion by major tech giants such as Amazon. The e-commerce giant has been expanding its corporate hometown operations primarily in and near downtown Seattle.

It could take several office tenants to fill up the space at the Auburn facility, based on the size of companies that are currently predominant in that area, leaving the possibility for industrial and other uses of the property if it is sold off by the government.

“It really depends on what the zoning would allow and what the developer would want to do with it,” Rice said. “It’s hard to imagine that someone would want to tear down a building that was just renovated in 2006, but that’s a possibility.”

Miller said other factors to watch include how fast the properties get sold off by the government and whether officials decide to sell them as one or two large portfolios, or instead choose to shed some individually in one-off deals.

In several locations, the government could get more for the properties by selling them separately, but finalizing several separate deals could also take longer to dispose of the assets and garner the revenue that the government is seeking.

“They’re going to be incentivized to sell these in a relatively short time frame, if they’re looking to capitalize while the market is still at its current peak,” Miller said.

Because some of the federal properties are older and not in neighborhoods deemed the hottest for offices, brokers said their future owners will probably require substantial financial resources to weather long transition periods in which the properties are being approved for significant renovations or repurposing.

That’s a potentially time-consuming prospect in states such as California, where projects must clear numerous environmental and other hurdles, especially in coastal locations.

“It’s going to take patient money, from experienced developers who are able to afford the carrying costs for a project that might take five years to approve,” Miller said.

These are the Western U.S. properties on the national list of locations recently targeted for potential sell-off by the GSA:

Sacramento Job Corps Center, excess land sale only, 3100 Meadowview Road, Sacramento, California, Department of Labor.
Southwest Fisheries Science Center, 1352 Lighthouse Ave., Pacific Grove, California, Department of Commerce.
Veterans Affairs Denver Medical Center, partial sale, 1055 Clermont St., Denver
Auburn Complex, 400 15th St. SW, Auburn, Washington, GSA.
Menlo Park Complex, 345 Middlefield Road, Menlo Park, California, GSA.
Chet Holifield Federal Building, 24000 Avila Road, Laguna Niguel, California, GSA.
WestEd Office Building, 4665 Lampson Ave., Los Alamitos, California, Department of Education.
Federal Archives and Records Center, 6125 Sand Point Way NE, Seattle, National Archives and Records Administration.

Link to article: Government Surplus Properties

4th Quarter 2019 Industrial Market Summary
-San Francisco & Peninsula

The reported industrial vacancy rates in San Francisco and surrounding Peninsula areas increased to 4.1% at the end of Q4 2019 (up from 3.5% in Q3 2019). The Bayshore Corridor of San Francisco vacancy rate increased to 3.3% in Q4 (up from .9% in Q3 2019). The San Francisco/Peninsula market reported a delivery of 34,200+/- square feet of new construction, and 2,772,511 square feet of product under construction, primarily in South San Francisco, Brisbane & Daly City. The industrial core of San Francisco (Bayshore / Potrero Hill / Dogpatch) reported 238,000+/- square feet of product under construction, with zero deliveries, or construction starts.

Q4 2019 ended with averaged over-all asking rents (industrial and flex) remaining at $2.26 per square foot, representing no change over the previous quarter. Comparatively, current average US industrial asking rents are reported as $.72 per square foot (no change from Q3 2019). Asking rents specific to warehouse product dipped slightly to $1.83 psf at the end of Q4 (down from $1.88 Q3). Quoted daily warehouse asking rents for the Bayshore Corridor at the end of Q4 increased to $2.10 psf from $2.04 psf at the end of Q3. Year-over-year market rents have increased by 2.7% for the San Francisco/Peninsula industrial/flex market.

Q4 2019 Industrial sale transactions are down from Q3 2019 with $174M in sales volume averaging $362 per square foot compared to $440M in sales averaging $360 per square foot in Q3 2019. CAP rates averaged 4.7% in Q4, representing no change over the previous quarter. National CAP rates have remained at 6.7% for Q1-Q4 2019.

Calco Commercial has leased and sold 1,505,690+/- square feet of industrial, flex, office and land in 2019 comprising 83 transactions, with 407,846+/- square feet and 24 transactions in Q4 alone. Following are the notable Q4 2019 transactions: 1000 25th Street, San Francisco (18,432 +/- sf industrial lease), 195 Bayshore Boulevard, San Francisco (21,000+/- sf industrial lease), and 415 E. Grand, South San Francisco (21,000/- sf industrial lease), and 464 9th Street, San Francisco (16,080+/- commercial/sale). Calco Commercial is a leading industrial & commercial real estate firm with decades of experience in Landlord /Owner representation, and repositioning assets into net leased properties with in-place income streams. Let us help make the most of your real estate properties and investments.

If you would like to discuss your real estate options, or would simply like more information related to current market conditions, please call our office a 415.970.0000, or directly contact one of our professionals.

CLICK HERE FOR THE FULL REPORT: Q4 Industrial Market Report

The reported industrial vacancy rates in San Francisco and surrounding Peninsula areas decreased to 3.5% at the end of Q3 2019 (down from 3.8% in Q2 2019). The Bayshore Corridor of San Francisco witnessed yet another decrease in vacancy to a sub 1% rate of .5% (down from .9% in Q2 2019). The San Francisco/Peninsula market reported a delivery of 21,807+/- square feet of new construction, and 2,568,754 square feet of product under construction, primarily in South San Francisco, Brisbane & Daly City. The industrial core of San Francisco (Bayshore / Potrero Hill / Dogpatch) reported 56,121 square feet of product under construction, with zero deliveries, or construction starts.

Q3 2019 ended with averaged over-all asking rents (industrial and flex) down from $2.30 per square foot to $2.26 per square foot, representing an 1.9% decrease over the previous quarter. Comparatively, current average US industrial asking rents are reported as $.72 per square foot (up from $.71 at the end of Q2 2019). Asking rents specific to warehouse product remained at $1.88 psf at the end of Q3 (no change from Q2). Quoted daily warehouse asking rents for the Bayshore Corridor at the end of Q3 decreased to $1.97 psf from $2.04 psf in Q2. Year-over-year market rents have decreased by 3.9% for the San Francisco/Peninsula industrial/flex market.

Q3 2019 Industrial sale transactions are up from Q2 2019 with $408M in sales volume averaging $334.00 per square foot compared to $308M in sales averaging $328.61 per square foot in Q2 2019. CAP rates averaged 4.9% in Q3 & Q2 2019, representing a minimal increase over Q1 2019 CAP rates of 4.85%. National CAP rates have remained at 6.7% for Q1-Q3 2009.

Calco Commercial has leased and sold 1,097,884+/- square feet of industrial, flex, office and land in 2019 comprising 59 transactions, with 179,124+/- square feet and 16 transactions in Q3 alone. Following are the notable Q3 2019 transactions: 253 Utah Avenue, South San Francisco (14,250 +/- sf industrial lease), 81 Dorman Avenue, San Francisco (12,500+/- sf industrial lease), and 3012 Spring Street, Redwood City (5,000/- sf commercial/sale), and 4870 Centennial Boulevard, Colorado Springs (50,000+/- commercial/sale). Calco Commercial is a leading industrial & commercial real estate firm with decades of experience in Landlord /Owner representation, and repositioning assets into net leased properties with in-place income streams. Let us help make the most of your real estate properties and investments.

If you would like to discuss your real estate options, or would simply like more information related to current market conditions, please call our office a 415.970.0000, or directly contact one of our professionals.

Click here for the full report: Q3 2019 Industrial Market Report

Source: CoStar
By: Jesse Gundersheim

While some investors are exploring secondary and even tertiary markets throughout the country in search for higher yields, coastal gateway cities continue to take home the lion’s share of capital investment.

As typical, New York outpaces all other U.S. markets by far. Next up is Boston, then Los Angeles, Washington D.C. and Seattle. And while San Francisco and San Jose in California rank sixth and seventh, respectively, and the state’s East Bay rounds out the nation’s top 15, if all the Bay Area markets were combined they would outpace all but New York.

It’s further evidence of enduring demand generated by buyers attracted to the Bay Area’s expanding tech industry, along with several owner-user acquisitions, which has maintained downward pressure on capitalization rates, or the expected rate of return on investment, at premium asset pricing.

Combined, the three major Bay Area markets have seen $12.5 billion of office assets sell over the past 12 months, behind only New York’s $19.6 billion.

Sales volume in San Francisco alone, at $5.2 billion year to date, has already eclipsed the previous two year’s annual totals.

Boston, Los Angeles and Washington, D.C., have each seen about $8 billion in office assets trade over the past year.

Source: CoStar News
By: Molly Armbrister

Life Science Industry Elbows Its Way Into Tight Bay Area Property Market
Rock-Bottom Vacancy Rates Pervade the San Francisco Peninsula

Like the organisms it studies, the life science industry in the San Francisco Bay is adapting to its changing surroundings.

Stiff competition from well-heeled tech giants such as Salesforce and Uber in areas such as downtown San Francisco is preventing the life sciences industry, which has had a foothold in the region for decades, from elbowing its way into commercial real estate around the city. So the life science industry has begun looking south, where developers are planning unprecedented ways to accommodate the industry, one of the fastest-growing in the United States, with the area’s first high-rise for science firms.

“There’s a confluence of industries that are booming all at the same time,” said Marc Pope, executive director at commercial real estate firm Cushman & Wakefield. “Life science, technology, automotive technology. In some ways, they’re competing for space. Elsewhere, traditional office is being bought and converted to lab space.”

The life science industry combines health care and technology into a field that seems in some ways recession-proof and requires large amounts of specialized real estate. Life science employment grew nationwide by 4.5% between 2010 and 2018, compared with total employment growth of 1.7%, according to the U.S. Bureau of Labor Statistics. Since 2000, the life science sector has grown nearly five times as fast as the rest of the economy, adding 85,000 jobs, according to a Cushman report.

Organic growth stemming from an aging population that wants and needs new treatments for ailments, and expansion enabled by technological advances in the field, resulted in a growing share of life science space needed in several of the country’s biggest markets. The way different south Bay Area cities are dealing with the region’s industry growth could provide a window into how other top industry cities such as Boston and San Diego deal with the space crunch in coming years.

While San Francisco and the city of South San Francisco are both almost fully occupied, the cities are each handling the sector’s growth differently. Life science companies aren’t receiving much assistance in their competition with the major tech companies in San Francisco, but they are being welcomed with open arms by the adjacent city of South San Francisco and others eager to capture the spillover demand with new development, which could spur even more expansion in the future.

According to CoStar data, San Francisco’s Mission Bay neighborhood property market, for example, is about as tight as it can get: The overall office vacancy rate in that neighborhood is 0.3%.

Mission Bay is part of an area in San Francisco that was targeted for life science companies by a 2008 plan passed by the City and County of San Francisco that created a life sciences and medical special use district.

But that overlay didn’t exclude other uses, and 10 years after it was put in place, the development capacity there is largely maxed out by the tech giants that have given the city its reputation, Pope said.

Among the biggest new tenants in Mission Bay is ride-hailing app maker Uber, which is planning to take up 1 million square feet of new development adjacent to Chase Center Arena, the $1.4 billion multi-purpose stadium and future home of the NBA’s Golden State Warriors that is scheduled to open before the 2019-2020 season.

It reflects the way new development in San Francisco is getting scooped up by these major tech companies, who offer a cache — and sometimes a rental rate — that many life science companies don’t have, forcing the firms to look elsewhere if they want to expand.

Going Vertical

Contrast that with the city of South San Francisco, which in 1976 was dubbed the “Birthplace of Biotechnology” by Genentech, the bioscience company that was acquired by Roche Pharmaceuticals in 2009. There, developers are doing something unprecedented to find a home for life science companies: They’re going vertical.

A 20-story development called Genesis Towers has been taken over by life science companies looking for space. The two-building property was originally designed as office space and was supposed to be completed during the recession, but the economy got in the way, Pope said.

Now, it has been developed into two life science towers with a third planned. Shortly after the conversion was finished, the space was fully leased, according to Cole Speers, research analyst for Cushman & Wakefield in the Bay Area.

Going vertical on life science space is rare, as the properties have historically been low-slung, sprawling developments akin to industrial space.

Life science real estate, though, can include more than just office space, sometimes branching out into flex industrial and converted office spaces. Cushman’s numbers for Mission Bay life science property specifically show there is no vacancy in that neighborhood for life science real estate.

And because of its connection to the health care industry, which is largely viewed as a mostly recession-proof field because people will always need health care regardless of the economic outlook, life science is seen as a safe place to invest capital, whether that’s in new businesses or in real estate to house them.

Boston remains the U.S. life science capital, with companies there attracting $15.5 billion worth of venture capital funding from 2010 to 2018, but San Francisco and the peninsula are right behind, with $15 billion, according to venture capital tracking website PitchBook.

And while Boston has the lowest vacancy rate for life science of any market in the country at 0.7%, the biggest drop off in vacancy rate occurred in San Francisco, falling to 6.2% fourth quarter last year from 18.3% in the same quarter of 2008, according to data from Cushman.

The development activity and need for space is not expected to recede any time soon, either. And with the percentage of people aged 65 and older projected to rise to more than 20% by 2030, the industry is expected to grow even more, further increasing the need for real estate.

Link to article: Life Science Industry Elbows Its Way Into Tight Bay Area Property Market

Scott Mason of Calco Commercial has represented a multi-property sale in Potrero Hill including: 1400-1496 Minnesota Street, 1475 Indiana Street, 1050-1090 26th Street, 1501-1599 Tennessee Street, 2930-2990 3rd Street & 826 26th Street. Comprised of nearly two city blocks, and multiple units totaling 120,000+/- square feet, the properties recently sold for $47,750,000.

The subject properties are situated in a very desirable Potrero Hill/Dogpatch location near the 3rd Street corridor light-rail, I-280, restaurants, cafes and other specialty retail exclusive to San Francisco. The buildings include highly functional industrial units with high ceilings, concrete construction, dock-high and drive-in loading capabilities. The portfolio had been held by BIC Bisco for 45+ years, and was acquired by Terreno Realty Corporation.

Click here for the Sale Profile: 1400 Minnesota – 1501 Tennessee SOLD

Source: CoStar News
By: Jesse Gundersheim

San Francisco added significantly more jobs in 2018 than first reported, and received the strongest upward revision among all major markets in the country.

On the heels of recent tech expansions in San Francisco’s office market, the city added 3.9% more workers last year over 2017.

The U.S. Bureau of Labor Statistics (BLS) revised its job growth statistics for 2018, recently, as it does every year after giving an early tally. Initially, the BLS estimated that San Francisco’s metropolitan division added 24,500 jobs, or a 2.2% increase. Revised data shows that San Francisco – including San Mateo County – actually added closer to 43,900 jobs in 2018.

The stronger numbers in job growth more closely align with the occupancy gains seen in San Francisco’s office market, where 4.9 million square feet were added in 2018.

Major employers in San Francisco such as Facebook, Uber and Google have already secured office space for future growth, providing capacity to grow the area’s workforce in 2019 and beyond.

Job growth was stronger from 2012 through 2015 than it is today, but it remains solid. As long as venture capital investment pours into locally based startups, and established tech companies increase profitability, the tech companies attracting highly skilled workers to San Francisco from around the world will continue to fuel local job growth.

As of the latest BLS release providing preliminary data for March 2019, San Francisco’s 12-month gain in employment registers 3.7%, close to the 3.9% of 2018. Job growth grew nationally by 1.8%.

Link to article: San Francisco’s 2018 Job Growth Revised

Source: CoStar
By: Diana Bell

Prologis, the country’s largest owner of industrial real estate, is raising its projected earnings for the coming year by more than 2% as it pursues further rent increases and seeks to capitalize on a preference for smaller warehouse developments.

The real estate investment trust, headquartered in San Francisco, said rent growth will be about 4% globally, principally driven by the United States, though Europe is expected to outperform later in the year, Chief Financial Officer Thomas Olinger said Tuesday on a conference call with analysts discussing first-quarter financial results.

Prologis plans to spend $2 billion on starting development and $600 million on acquisitions but seeks to reduce its ownership in open-ended European funds from 28 percent to 24 percent to accommodate “partners and bring ownership in line” with a long-term target of 15% on the continent, Olinger said.

The REIT signaled a focus on smaller-sized warehouse space, with only about 25% of its portfolio comprising big-box regional facilities over 250,000 square feet. About two-thirds are less than 250,000 square feet.

“We are seeing higher rent change on roll under 250,000 square feet versus bigger box, and that spread is accelerating. We are well-positioned to capture that opportunity,” said Olinger.

Chairman Hamid Moghadam doesn’t see weakness in large space demand but said “there are some markets on the periphery like outlying corridors of Chicago where there are a lot of big buildings and market rent is softer now until those buildings get absorbed.”

The executives declined to name locations Prologis is considering, but Moghadam said the REIT is staying out of overdeveloped markets.

“The big boxes got their growth early in the recovery cycle. They are up significantly on 40% to 50% in the past four to five years. Now they are taking a back seat to the medium and smaller spaces,” he said.

The REIT’s strategy this year will be to push rents up. “Don’t be surprised if you see occupancy be a little lower throughout the year,” said Olinger. “We are going to make the right long-term decision, which is going to be pushing rents and extending term.” Prologis expects to end the year with an uptick in occupancy to 97.5%.

As the first developer to build a multistory warehouse in the United States, Prologis has faced headwinds with leasing the three-story, 589,000-square-foot Seattle building known as Prologis Georgetown Crossroads, where it is asking for rents in the range of $1.30 to over $2 a square foot.

Of the Seattle property, Olinger said, “We have done a 100,000-square-foot lease in this asset, and one lesson we’ve learned about this is there is a process that we have to go through with customers. It is a new product in a new location. We need to get a premium and we think we’ll get that premium, but deal gestation periods are long and they will continue to be long until customers are basically more accustomed to this product.”

The REIT said it will pursue opportunities with Seattle-based online retailer Amazon, its largest customer.

“Broadly we are seeing customers like Amazon and other customers focused on e-commerce with some network rollouts involve a combination of large buildings and a series of higher number of smaller buildings that are located close-in to larger population centers, all of which fit really well for our portfolio,” said Olinger.

Moghadam noted the smaller-footprint buildings these types of tenants are favoring offer more options in terms of parcel size and have higher clear heights with more mezzanine floors, which effectively increases space utilization.

Of the 772 million square feet Prologis had within its portfolio as of March 31, 59% was U.S.-based and is expected to generate 77% of the REIT’s net operating income for the year. Prologis has about $97 billion in assets under management.

Some of the largest shippers and household-name companies lease from Prologis, with Amazon in first place contributing to 3.6% of its net effective rent. Amazon leases about 20.7 million square feet. Shippers DHL, UPS and FedEx, retailer Home Depot and automaker BMW all rank within Prologis’ top 10 largest customers. Retail giant Walmart is in 11th place with 4.4 million square feet. And the U.S. government ranks 19th, with just over 1 million square feet.

This year, Prologis expects to complete just under 12.4 million square feet of development activity for properties it will fully own and manage spending $1.1 billion to do so. Roughly half of that development is planned for the Western United States. For 2020 and beyond, so far it has docketed 1.6 million square feet in development solely in the West.

Of the $239 million Prologis spent on development starts globally in the first quarter, just 41.2% is build-to-suit, showing a bulk of speculative industrial work.

Despite recording a decline in net earnings in the first quarter, the REIT saw rental revenues jump year-over-year to $696.8 million compared to $555.9 million. Occupancy was roughly flat at 96.8%, but Prologis leased 43 million square feet in the first quarter, compared to 33 million the in the same quarter a year ago.

The results follow what Moghadam called Prologis’ “strongest year ever” in 2018. The REIT embarked on $3.1 billion in new developments globally totaling 36 million square feet. The year also saw Prologis sell off an 86-property portfolio to MapleTree and acquire Denver-based industrial REIT DCT Industrial.

Link to article: Prologis Sees Opportunity in Smaller Warehouse Footprints

For its 7th year in a row, Calco Commercial has been named as a top brokerage firm in San Francisco.

Calco Commercial leased and sold 1,112,761+/- square feet of industrial, flex, office and land in 2018 comprising 66 transactions. Calco Commercial is a leading full-service industrial & commercial real estate firm with decades of experience in Landlord /Owner representation, 1031-exchanges, property management and property valuations. Let us help make the most of your real estate properties and investments.

Source: CoStar
By: Diana Bell

Related Companies, one of the largest developers in New York City and a significant builder nationally, established an opportunity zone fund targeting $250 million in investments to become the latest investor to take advantage of the program designed to spark development.

The move signals that interest keeps growing among investors to stream capital toward opportunity zones, which are federally mandated swaths of land in economically depressed areas that carry tax breaks for commercial real estate investors.

“Nationally there has been a spike in investor interest and activity for opportunity zone properties,” said Darin Mellot, head of research for the Americas at commercial brokerage firm CBRE. “There is really nothing I am questioned about more, except when is the next recession.”

Related declined to comment to CoStar News with further information explaining the investment goals of the new fund, reported in a Securities and Exchange Commission filing last week, such as which markets it is targeting.

Related is not the only big name in commercial real estate to launch a fund under the federal Opportunity Zone program. Normandy Real Estate Partners has a $250 million fund, Starwood Capital and RXR Realty have each launched $500 million funds, and CIM Group has a $5 billion fund.

Created by Congress in 2017 as part of the Tax Cuts and Jobs Act, the Opportunity Zone program encourages investments of at least five years in order to defer portions of capital gains taxes. For example, an investment of $10 million would, if sold after five years, be taxed on just $9 million. After seven years, the taxable amount would be $8.5 million. If held for at least 10 years and sold, gains would become tax-free.

“Opportunity zones are a generational type of incentive, not just for New York City but across the country. There are real advantages to be reaped with the program, and it’s no surprise that multiple institutional groups are rolling out funds. The investor pool for this strategy has expanded significantly,” said Victor Sozio, executive vice president in the investment sales group at commercial real estate services firm Ariel Property Advisors.

Of the 258 opportunity zone funds tracked by CoStar News, just over 33 percent plan to raise at least $100 million, and about 14 percent are targeting at least $250 million. Roughly 22 percent of the funds could be traced back to investors in New York and New Jersey, based on zip code. The 22 percent concentration combining New York and New Jersey outstrips the next-largest clusters of investors. About 8 percent of funds tracked hail from California, followed by 6 percent from Virginia.

New York state has a significant number of census tracts designated as opportunity zones, with 514. By comparison, California, a state three times the size of New York, has 879. There are 8,700 Opportunity Zones identified across the country.

New York City Investment

“In New York City, we’ve already seen increased activity in contract signings due to properties located in Opportunity Zones,” said Sozio, adding that his firm’s assignments under contract achieved 10 percent to 30 percent more in asking price because of stiff competition for Opportunity Zone investments.

But because of the cost to develop within New York City, neighborhoods in northern Manhattan and the Bronx are attracting a bulk of activity.

“The program is designed to incentivize development in depressed areas, but in New York City many of the areas that have been designated as Opportunity Zones are in areas that are already emerging markets, such as Mott Haven in the Bronx and Harlem, Washington Heights and Inwood in northern Manhattan,” Sozio said. “Inwood, for example, is benefiting from a double whammy of investor interest. It has been rezoned to allow more density and it is located in an Opportunity Zone. It is a neighborhood in Manhattan where pricing is still conducive to build rental buildings, and investors can also benefit from the Opportunity Zone structure. Inwood is a bit more attractive because you can buy land at $130 to $140 per buildable square foot.”

Manhattan has an Opportunity Zone in Hell’s Kitchen and one on the Lower East Side, but these areas below 96th Street prove challenging because their development sites have been trading based on condominium executions, noted Sozio.

“The program is not designed for a condominium developer because they don’t typically hold for 10 years. How do you secure a site that makes sense for a rental play in Manhattan? It is difficult because of pricing,” he said. “For parcels, you need to buy at $300 per buildable square foot in the Lower East Side to make it work … and sellers won’t sell because that is below market pricing. Those parcels are trading at $500 per buildable square foot.”

James Nelson, head of tri-state investment sales at commercial real estate services firm Avison Young, has predicted that 2019 will experience a 20 percent uptick in sales of development sites within the five boroughs of New York City because of opportunity zones.

“The investment possibilities that opportunity zones can provide in New York and around the country are huge to real estate and non-real estate investors. For real estate investors it is clear and intuitive. They look at the deal and invest. But for investors with non-real estate capital gains that cannot use a deferral program like 1031 exchanges, opportunity zones provide a great new avenue to accomplish a similar deferral with the possibility of back-end appreciation that they would not otherwise have,” explained Adam Sanders, an attorney specializing in investment transactions at law firm Rosenberg & Estis and its resident expert in opportunity zones.

Time Sensitivity

According to a 2019 real estate investment survey released by global business law firm Seyfarth Shaw, 32 percent of respondents said they will take advantage of the federal Opportunity Zone program as either an investor or a sponsor in 2019. Of that group, one-third are doing so to tap a new source of capital and a quarter are doing so to defer current taxable gains.

“Nationally the market is over a trillion dollars between capital gains of households and corporations, so there is significant capital moving into investment vehicles to take advantage of the capital gains savings,” said real estate adviser Greg Kraut, a managing partner of New York-based investment firm K Property Group and the CEO of bipartisan think tank Economic Policy Project.

One important caveat to opportunity zones is that they are time-sensitive. On December 31, 2026, a lump sum of taxes owed, based on hold times, are due.

“The tax benefits are time-sensitive, tax obligations are reduced more the longer you hold. You can only defer taxes for the period of time until 2026,” said Mellot. “Keep in mind that the IRS looks at two sets of gains, the original gain and the gain from the investment in the opportunity zone itself. There is no preferential tax treatment on the gain from the investment itself if you hold for 0-9 years.”

Facing an ever-dwindling timeline, the rush to invest nationally is being played out via pricing premiums on property trades.

“We are aware of some premiums being for paid for properties in opportunity zones, with some data showing a 5-percent to 10-percent premium on trades in select zones,” Mellot said of select zones nationally, but added he could not say for sure that finding is uniform.

Working It Out

But there is some uncertainty on key aspects of the Opportunity Zone framework, for which investors are still waiting on further guidance from the government. One significant area that has not been clarified is the federal government’s stance on refinancing an opportunity zone property. That would enable investors to recoup a bit of capital and would make it easier for smaller investors to play in the space.

“Certain ambiguities regarding technical details, such as whether that can be a distribution of proceeds during the hold period. If you can’t refinance and distribute proceeds during the hold, that doesn’t make much sense for investors. It especially puts smaller developers at a distinct disadvantage, because they don’t have the capital depth and scale to hold for a decade [compared to larger institutional investors.] Large funds have sufficient liquidity and scale to weather that,” noted Sozio.

A seminar scheduled for January to work out these kinks was canceled because of the government shutdown and investors are expecting additional guidance in the coming months.

One issue to watch, according to Kraut, is whether opportunity zones are artificially creating demand by forcing investment. Sanders said that the more complicated a transaction or development play, the more concern investors are showing until more guidance is released.

“For example, in New York City, a good amount of development is done on ground leases. Currently, New York views long term ground leases as real property but the IRS still has not confirmed that. This is holding up development on ground leases that want to utilize the OZ Program for investors,” he said.

Asked his perspective on pros and cons of opportunity zones, Sanders said, “Pros are that the Opportunity Zone program will provide an additional benefit for investors on deals that they were going to invest in already and potentially draw investors to deals for developments that are just on the edge of being viable. Cons are that some developers and investors are going forward without proper ongoing legal and accounting guidance.”

In light of the uncertainty, investors would be wise to step back from the fervor and scrutinize the merits of the investment strategy for a property or land parcel.

“Governors can designate up to 25 percent of their census tracts as opportunity zones, so there is a large volume of zones, but you still need to have an investment strategy. Sound investment principles still apply. Not all zones will make sense for investment. The OZ deals must have a market reason to make sense,” said Mellot.

“Investors should be cautious in these funds to make sure the underlying investment is viable, not just jump into it because it is located in an opportunity zone,” Sozio noted.

Link to article: Opportunity Zone