Category: San Francisco Commercial Real Estate Listings] (43)

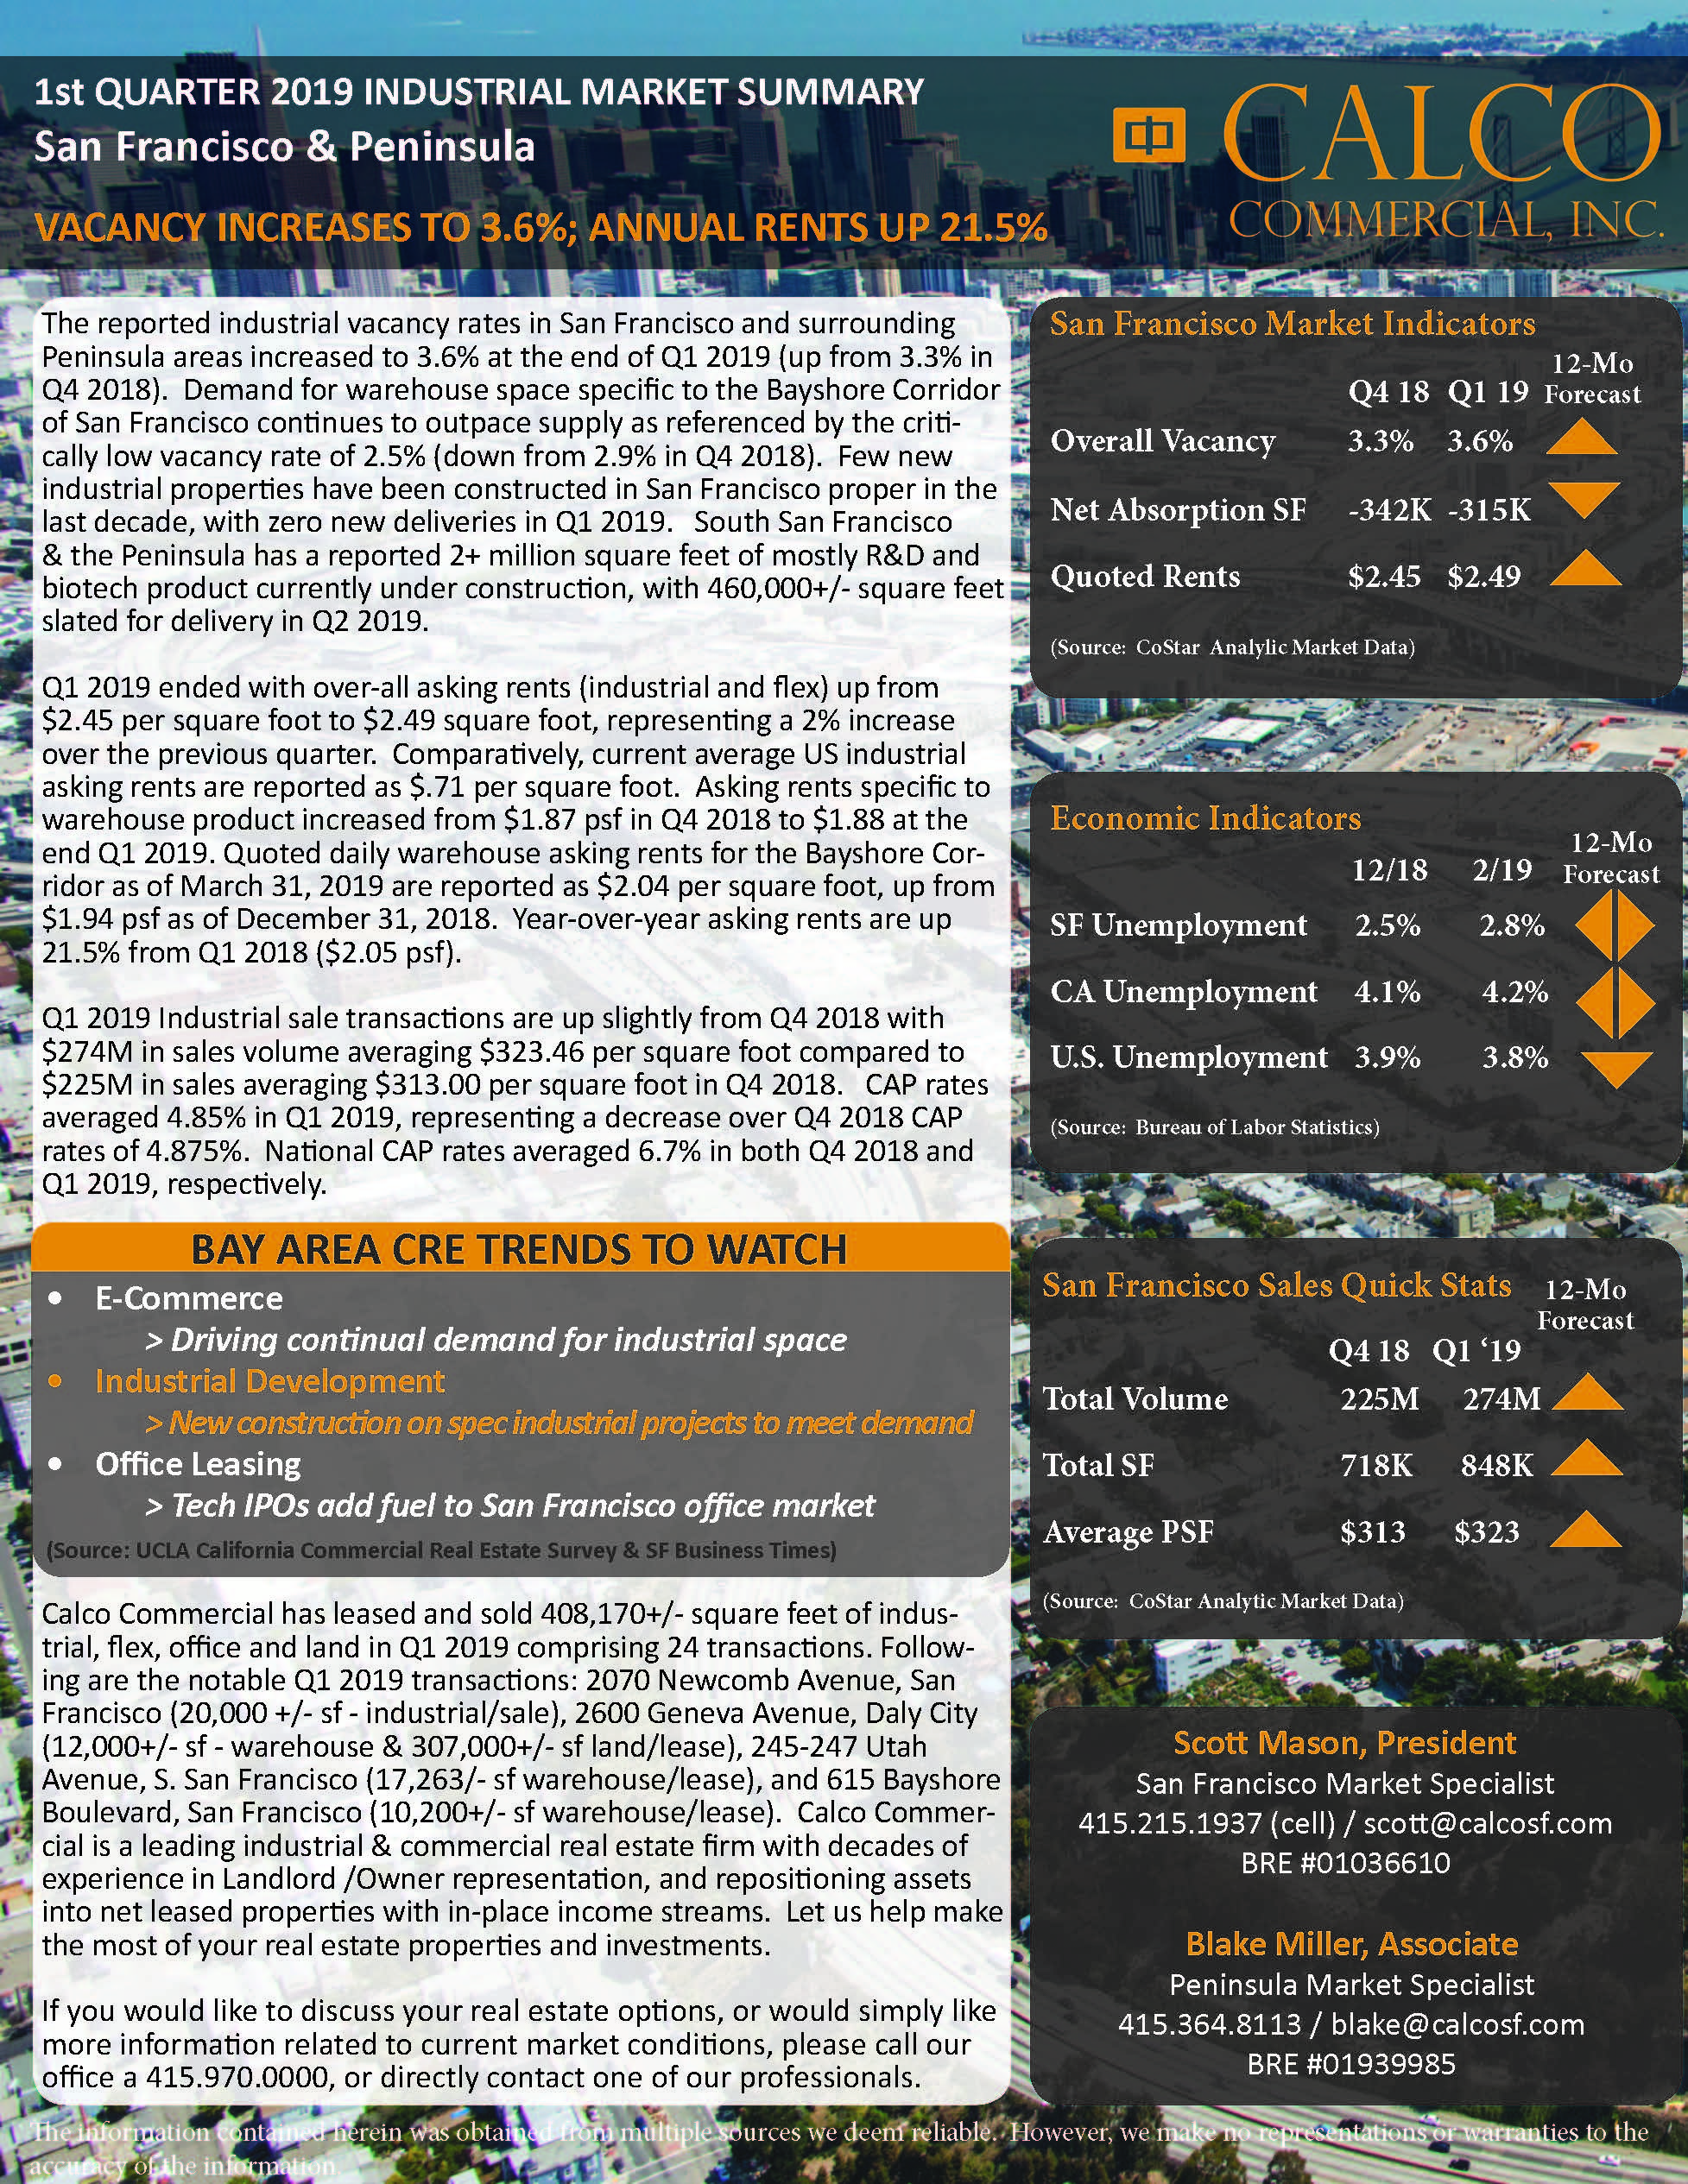
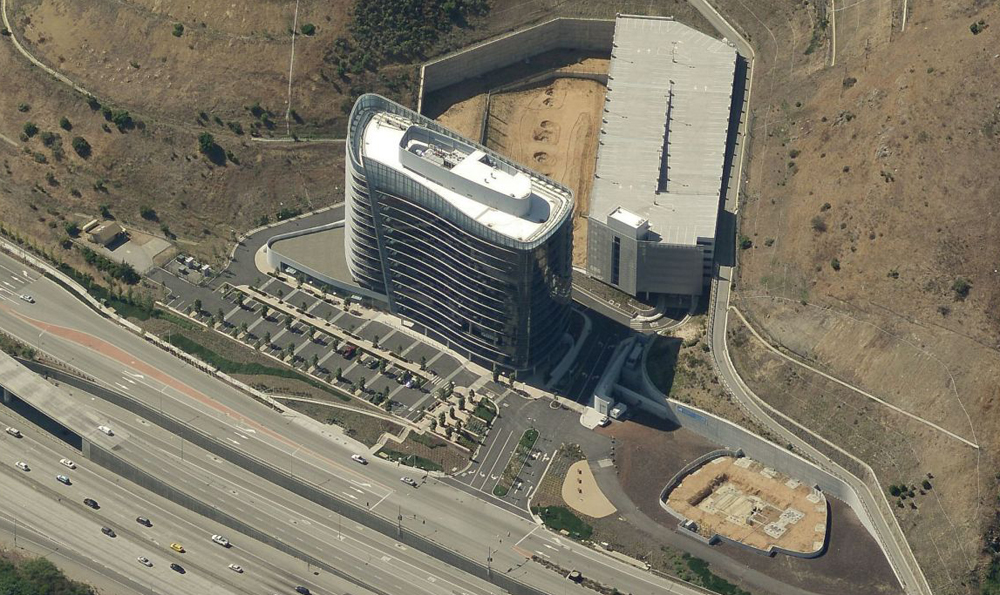
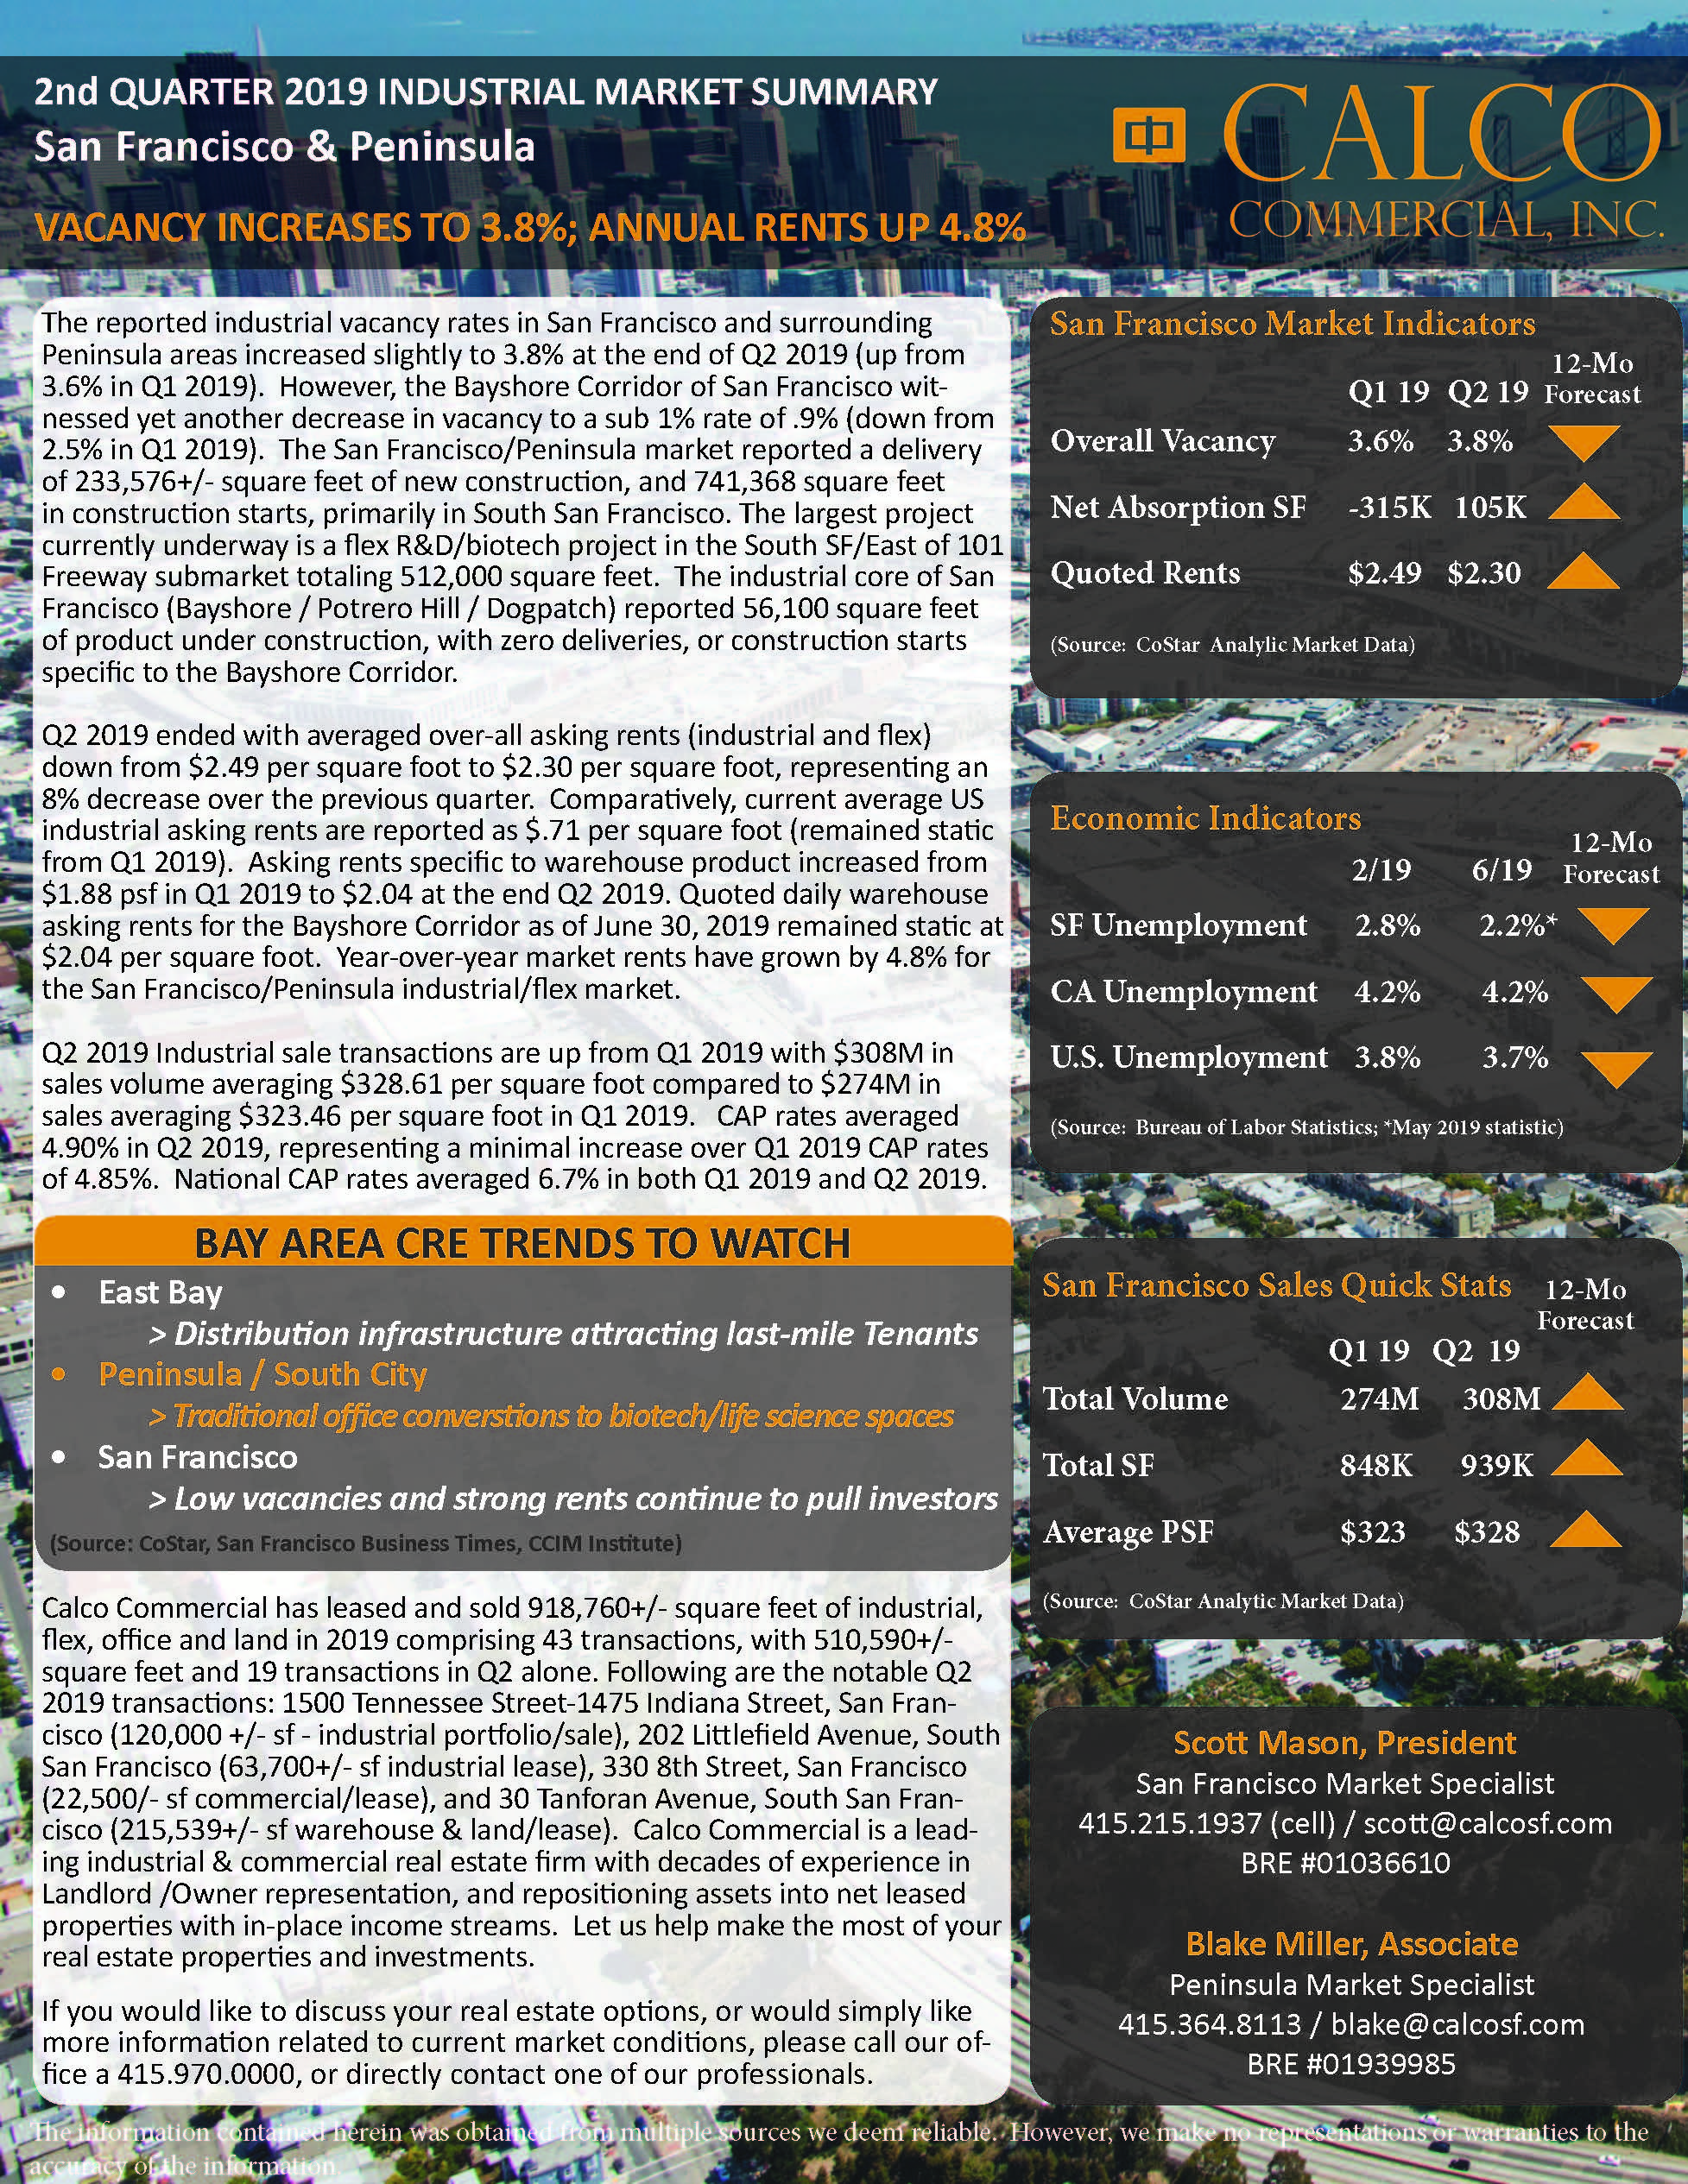
The reported industrial vacancy rates in San Francisco and surrounding Peninsula areas increased slightly to 3.8% at the end of Q2 2019 (up from 3.6% in Q1 2019). However, the Bayshore Corridor of San Francisco witnessed yet another decrease in vacancy to a sub 1% rate of .9% (down from 2.5% in Q1 2019). The San Francisco/Peninsula market reported a delivery of 233,576+/- square feet of new construction, and 741,368 square feet in construction starts, primarily in South San Francisco. The largest project currently underway is a flex R&D/biotech project in the South SF/East of 101 Freeway submarket totaling 512,000 square feet. The industrial core of San Francisco (Bayshore / Potrero Hill / Dogpatch) reported 56,100 square feet of product under construction, with zero deliveries, or construction starts specific to the Bayshore Corridor.

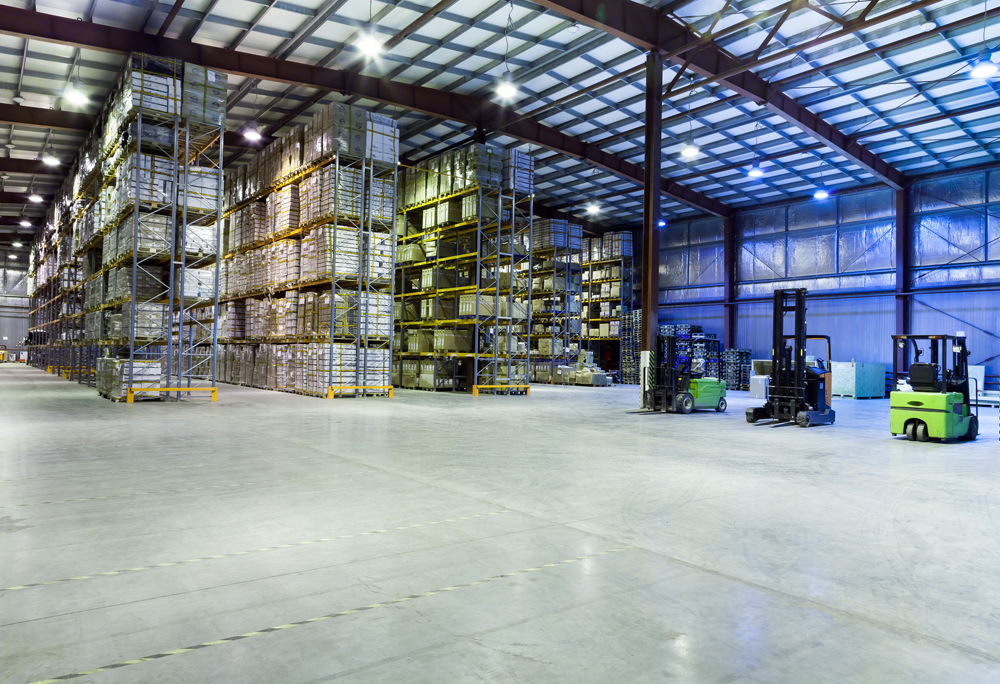
Q2 2019 ended with averaged over-all asking rents (industrial and flex) down from $2.49 per square foot to $2.30 per square foot, representing an 8% decrease over the previous quarter. Comparatively, current average US industrial asking rents are reported as $.71 per square foot (remained static from Q1 2019). Asking rents specific to warehouse product increased from $1.88 psf in Q1 2019 to $2.04 at the end Q2 2019. Quoted daily warehouse asking rents for the Bayshore Corridor as of June 30, 2019 remained static at $2.04 per square foot. Year-over-year market rents have grown by 4.8% for the San Francisco/Peninsula industrial/flex market.

Q2 2019 Industrial sale transactions are up from Q1 2019 with $308M in sales volume averaging $328.61 per square foot compared to $274M in sales averaging $323.46 per square foot in Q1 2019. CAP rates averaged 4.90% in Q2 2019, representing a minimal increase over Q1 2019 CAP rates of 4.85%. National CAP rates averaged 6.7% in both Q1 2019 and Q2 2019.

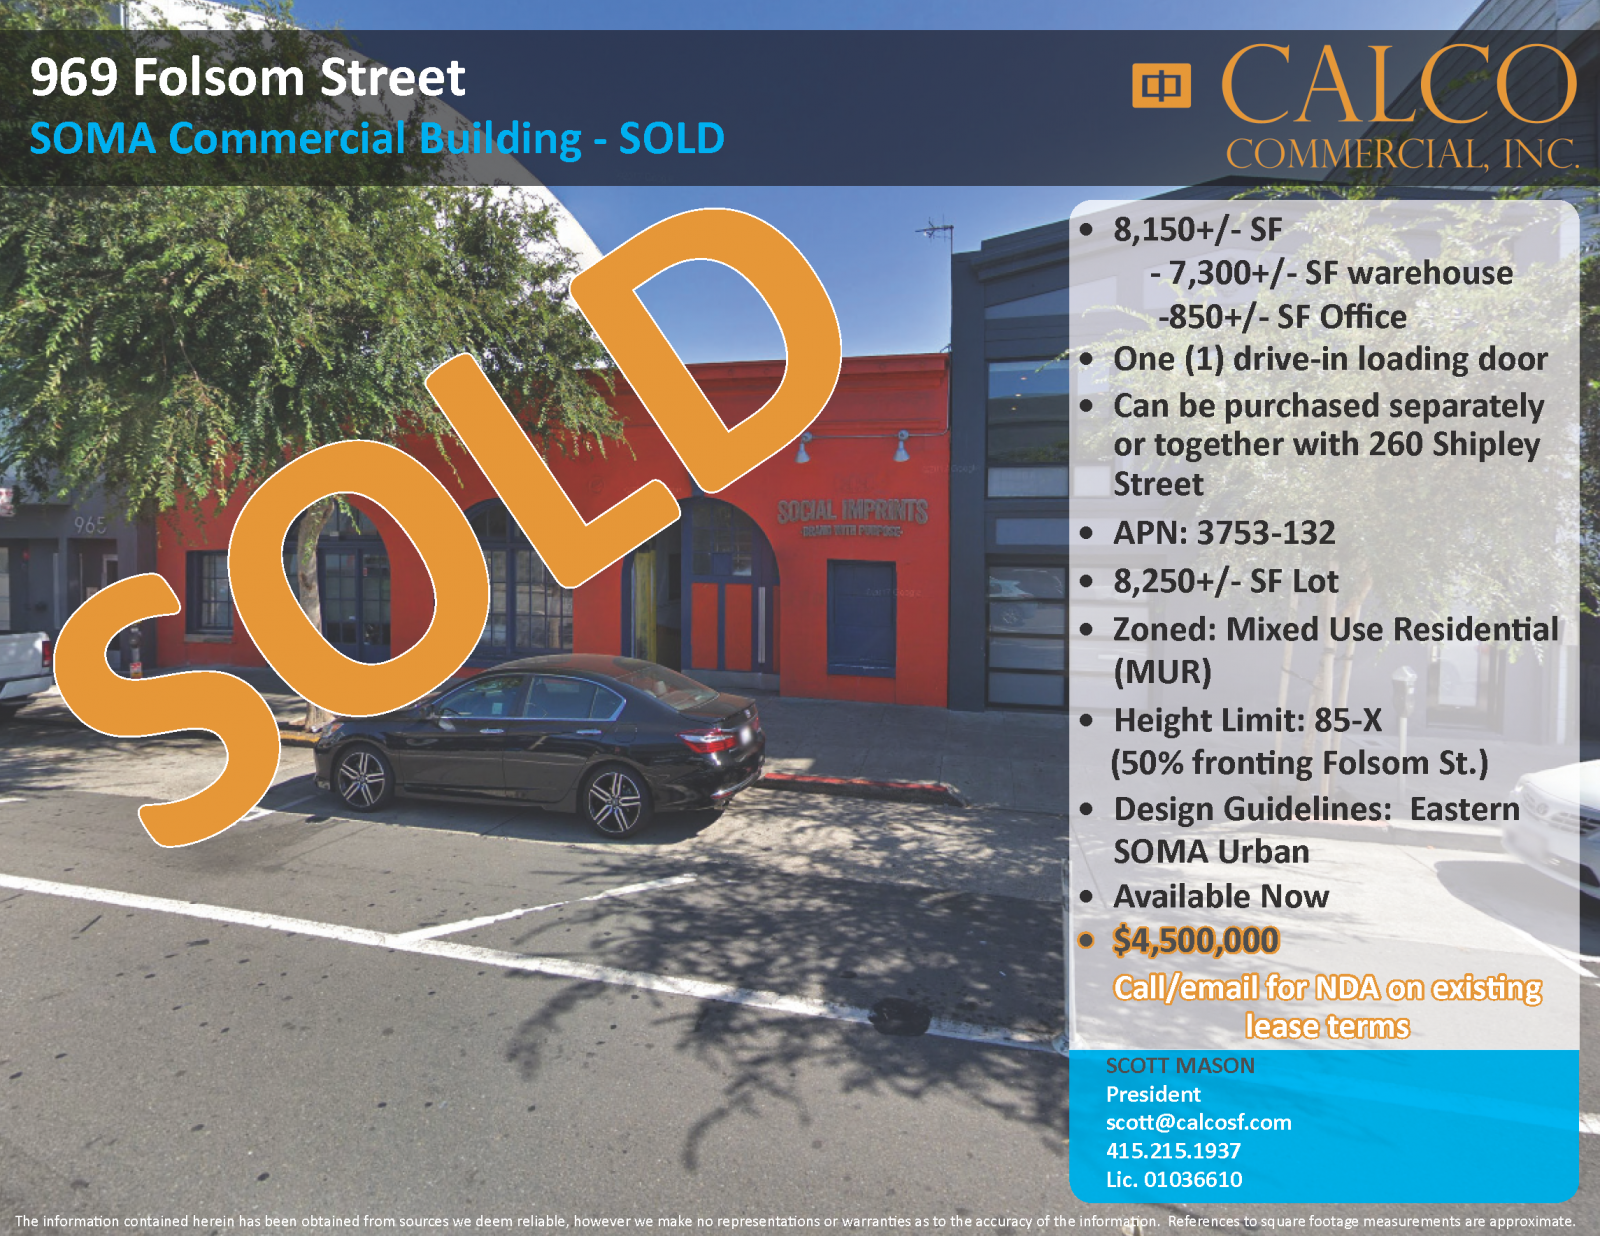
Calco Commercial has leased and sold 918,760+/- square feet of industrial, flex, office and land in 2019 comprising 43 transactions, with 510,590+/- square feet and 19 transactions in Q2 alone. Following are the notable Q2 2019 transactions: 1500 Tennessee Street-1475 Indiana Street, San Francisco (120,000 +/- sf – industrial portfolio/sale), 202 Littlefield Avenue, South San Francisco (63,700+/- sf industrial lease), 330 8th Street, San Francisco (22,500/- sf commercial/lease), and 30 Tanforan Avenue, South San Francisco (215,539+/- sf warehouse & land/lease). Calco Commercial is a leading industrial & commercial real estate firm with decades of experience in Landlord /Owner representation, and repositioning assets into net leased properties with in-place income streams. Let us help make the most of your real estate properties and investments.

If you would like to discuss your real estate options, or would simply like more information related to current market conditions, please call our office a 415.970.0000, or directly contact one of our professionals.

Click here for the full report: Q2 2019 Industrial Market Report – San Francisco & Peninsula

Source: CoStar News
By: Jesse Gundersheim

San Francisco added significantly more jobs in 2018 than first reported, and received the strongest upward revision among all major markets in the country.

On the heels of recent tech expansions in San Francisco’s office market, the city added 3.9% more workers last year over 2017.

The U.S. Bureau of Labor Statistics (BLS) revised its job growth statistics for 2018, recently, as it does every year after giving an early tally. Initially, the BLS estimated that San Francisco’s metropolitan division added 24,500 jobs, or a 2.2% increase. Revised data shows that San Francisco – including San Mateo County – actually added closer to 43,900 jobs in 2018.

The stronger numbers in job growth more closely align with the occupancy gains seen in San Francisco’s office market, where 4.9 million square feet were added in 2018.

Major employers in San Francisco such as Facebook, Uber and Google have already secured office space for future growth, providing capacity to grow the area’s workforce in 2019 and beyond.

Job growth was stronger from 2012 through 2015 than it is today, but it remains solid. As long as venture capital investment pours into locally based startups, and established tech companies increase profitability, the tech companies attracting highly skilled workers to San Francisco from around the world will continue to fuel local job growth.

As of the latest BLS release providing preliminary data for March 2019, San Francisco’s 12-month gain in employment registers 3.7%, close to the 3.9% of 2018. Job growth grew nationally by 1.8%.

Link to article: San Francisco’s 2018 Job Growth Revised

The reported industrial vacancy rates in San Francisco and surrounding Peninsula areas increased to 3.6% at the end of Q1 2019 (up from 3.3% in Q4 2018). Demand for warehouse space specific to the Bayshore Corridor of San Francisco continues to outpace supply as referenced by the critically low vacancy rate of 2.5% (down from 2.9% in Q4 2018). Few new industrial properties have been constructed in San Francisco proper in the last decade, with zero new deliveries in Q1 2019. South San Francisco & the Peninsula has a reported 2+ million square feet of mostly R&D and biotech product currently under construction, with 460,000+/- square feet slated for delivery in Q2 2019.

Q1 2019 ended with over-all asking rents (industrial and flex) up from $2.45 per square foot to $2.49 square foot, representing a 2% increase over the previous quarter. Comparatively, current average US industrial asking rents are reported as $.71 per square foot. Asking rents specific to warehouse product increased from $1.87 psf in Q4 2018 to $1.88 at the end Q1 2019. Quoted daily warehouse asking rents for the Bayshore Corridor as of March 31, 2019 are reported as $2.04 per square foot, up from $1.94 psf as of December 31, 2018. Year-over-year asking rents are up 21.5% from Q1 2018 ($2.05 psf).

Q1 2019 Industrial sale transactions are up slightly from Q4 2018 with $274M in sales volume averaging $323.46 per square foot compared to $225M in sales averaging $313.00 per square foot in Q4 2018. CAP rates averaged 4.85% in Q1 2019, representing a decrease over Q4 2018 CAP rates of 4.875%. National CAP rates averaged 6.7% in both Q4 2018 and Q1 2019, respectively.

Calco Commercial has leased and sold 408,170+/- square feet of industrial, flex, office and land in Q1 2019 comprising 24 transactions. Following are the notable Q1 2019 transactions: 2070 Newcomb Avenue, San Francisco (20,000 +/- sf – industrial/sale), 2600 Geneva Avenue, Daly City (12,000+/- sf – warehouse & 307,000+/- sf land/lease), 245-247 Utah Avenue, S. San Francisco (17,263/- sf warehouse/lease), and 615 Bayshore Boulevard, San Francisco (10,200+/- sf warehouse/lease). Calco Commercial is a leading industrial & commercial real estate firm with decades of experience in Landlord /Owner representation, and re-positioning assets into net leased properties with in-place income streams. Let us help make the most of your real estate properties and investments.

If you would like to discuss your real estate options, or would simply like more information related to current market conditions, please call our office a 415.970.0000, or directly contact one of our professionals.

Click here for the full Q1 Market Report 2019: Q1 2019 Industrial Market Report

Calco Commercial has leased and sold 1,112,761+/- square feet of industrial, flex, office and land in 2018 comprising 66 transactions, with 20 transactions totalling 409,070+/- square feet in Q4 alone. Following are the notable Q4 2018 transactions: 30 Tanforan Avenue, S. San Francisco (215,539 +/- sf – industrial/lot lease), 695 Minnesota Street, San Franicsco (25,000+/- sf – warehouse/lease), 350 Harbor Way, S. San Francisco (24,600+/- sf warehouse/sublease), and 301 Toland Street, San Francisco (36,000+/- sf warehouse/lease). Calco Commercial is a leading industrial & commercial real estate firm with decades of experience in Landlord /Owner representation, and repositioning assets into net leased properties with in-place income streams. Let us help make the most of your real estate properties and investments.

Click here for the full Q4 San Francisco/Peninsula Industrial Market Report:

Calco Commercial has recently sold both the 260 Shipley Street & 969 Folsom Street buildings. 260 Shipley Street is a two-story 3,750+/- square foot commercial building located in the SOMA with second floor office & ground floor warehouse. The property features skylights, private conference room, and a kitchenette in the office area and a drive-in roll-up entry for the warehouse.

969 Folsom Street is a 8,150+/- square foot commercial building located next door to 260 Shipley Street in the SOMA. 969 Folsom Street features 7,300+/- square feet of warehouse area with one drive-in loading door and 850+/- square feet of office with open and private areas and a kitchenette.

Calco Commercial specializes in the leasing and selling of commercial, office, industrial and NNN properties in and around San Francisco. If you have any questions about how to best re-position your asset in the Bay Area market, are a Tenant looking for space or have general market questions, call our office at 415.970.0000 and we can provide expert service.

With the ever present shift of brick & mortar retail to e-commerce, the recently completed 350K square foot “retail center” located at 945 Market Street may also undergoing a shift of its own. According to SocketSite, the developer Cypress Equities, “is now seeking approval to convert 47,522 square feet of the five-story building’s retail space into open floor office space.”

The San Francisco Planning Commission is scheduled to hear the proposed conversion pitch by mid-March 2018. What will become of the remaining vacant 217,000 square feet remains to be seen.

In a partnership with Build Inc., the San Francisco Recreation & Parks Department (RPD) plan on redeveloping over 38 acres of land in the India Basin area of San Francisco into a mixed-use project consisting of retail, commercial, residential and open spaces.

According the Draft Environmental Impact Report (EIR) released on September 13, 2017 (EIR-1 and EIR-2), two iterations of the project are being considered: “(1) a residentially-oriented project with approximately 1,240 dwelling units, 275,330 square feet of commercial space, 50,000 square feet of institutional space, and 1,800 parking spaces; or (2) a commercially-oriented variant with approximately 500 dwelling units, 1,000,000 square feet of commercial space, 50,000 square feet of institutional space, and 1,932 parking spaces.”

The Draft EIR public comment period now open through October 30, 2017 with a public hearing date scheduled for October 19, 2017.

Amazon today is posting another unique offering you can bid for online: a new headquarters site in North America.

The company is seeking sites in major North American cities for a “full equal” to its Seattle headquarters, dubbed Amazon HQ2. The online retailer expects to invest over $5 billion to build and operate its new co-headquarters, which it said could include as many as 50,000 high-paying jobs.

In addition, Amazon HQ2 is expected to create tens of thousands of additional jobs and tens of billions of dollars in additional investment in the surrounding community.

Amazon estimates its investments in Seattle from 2010 through 2016 resulted in an additional $38 billion to the city’s economy, providing data that showed every dollar invested by Amazon in Seattle has generated an additional 1.4 dollars for the city’s economy overall.

Real estate owners and state and local government leaders interested in learning more about how they can bring Amazon to their community can visit AmazonHQ2.

“Amazon HQ2 will bring billions of dollars in up-front and ongoing investments, and tens of thousands of high-paying jobs,” said Jeff Bezos, Amazon founder and CEO, in announcing the new headquarters search. “We’re excited to find a second home.”

Amazon listed the following criteria for choosing the location for HQ2:
Metropolitan areas with more than 1 million people;
A stable and business-friendly environment;
Urban or suburban locations with the potential to attract and retain strong technical talent; and
Communities that think big and creatively when considering locations and real estate options.

Amazon said the new location could be, but does not have to be, an urban or downtown campus with a similar layout to Amazon’s Seattle campus and a fully entitled, development-prepped site.

“We want to encourage states and communities to think creatively for viable real estate options, while not negatively affecting our preferred timeline,” the company said in its announcement.

Amazon expects to hire new teams and executives in HQ2, and said it plans to allow existing senior leaders across the company to decide whether to locate their teams in HQ1, HQ2 or both. The company expects that employees who are currently working in the Seattle HQ can choose to continue working there, or they could have an opportunity to move to HQ2.

Growing Exponentially

Amazon has been experiencing exponential growth and announced earlier this year hiring projections of adding more than 100,000 new, full-time jobs through next June. And, it has been expanding in markets across the country. The following is a list of major expansions undertaken just this year.

-Amazon Expansion Move – Date
-Opens search for Amazon HQ2 – A second headquarter city in North America — September-2017
-Announces first fulfilment center in New York, creating 2,250 full-time jobs — September-2017
-Expands in Oregon with Salem fulfilment center — August-2017
-Announces plans for new fulfilment center in Ohio — August-2017
-Completes acquisition of Whole Foods Market — August-2017
-Announces new fulfilment center in Romulus, OH — July-2017
-Opens new fulfilment center in Orlando — July-2017
-Announces plans for Salt Lake City fulfilment center — July-2017
-Announces new fulfilment center in Thornton, CO — June-2017
-Announces new fulfilment center in North Haven, CT — June-2017
-Announces plans to open first Oregon fulfilment center in Troutdale — June-2017
-Announces plans to expand in Miami with new fulfilment center — June-2017
-Announces fulfilment center to open in Fresno, CA — June-2017
-Announces new fulfilment center in Georgia — June-2017
-Announces plans to open three additional New Jersey fulfilment centers — April-2017
-Announces second Houston-area fulfilment center — March-2017
-Announces new fulfilment center in Virginia — March-2017
-Announces two new California fulfilment centers — February-2017
-Announces new air cargo hub in Kentucky — January-2017
-Announces first fulfilment center in Colorado — January-2017
-Amazon announces ninth fulfilment center in Texas; new robotics site — January-2017
-Announces new fulfilment center in Maryland — January-2017
-Confirms second Jacksonville fulfilment center — January-2017

Details of Amazon’s Current Seattle Headquarters

-Number of buildings — 33
-Square feet — 8.1 million
-Local retail within Amazon headquarters — 24 restaurants/cafes + 8 other services
-Amazon employees — 40,000+
-Capital investment (buildings & infrastructure) — $3.7 billion
-Operational expenditures (utilities & maintenance) — $1.4 billion
-Compensation to employees — $25.7 billion
-Number of annual hotel nights by visiting Amazonians and guests — 233,000 (2016)
-Amount paid into the city’s public transportation system as employees’ transportation benefit — $43 million

Source: CoStar News
Author: Mark Heschmeyer

Link to article: AMAZON

Achaogen, an antibacterial drug developer, has found new digs at the Genesis tower in South San Francisco. According to the San Francisco Business Times, Achaogen leased 47,000+ square feet comprised of the “entire third floor and part of the fourth floor,” all while scoring a “$5.6 million” tenant improvement package.

Genesis-South San Francisco

The Genesis building, formerly known as “Centennial Towers”, has historically been marketed as high-end office space and has experienced long swaths of vacancies. But, given the high demand for biotech/lab space, Phase 3 Real Estate Partners coverted the building from office to research and development as reported by the San Francisco Business Times earlier this year.

Achaogen is expected to employ over 200 employees at the site with other biotech companies expected to join the tenant roster early next year, according to the article. Phase 3 also intends to complete a “neighboring 21-story tower” in 2018.

Source: CoStar News
By: Randyl Drummer
Date Posted: July 20, 2016

Prologis, the world’s largest developer and owner of industrial real estate, reported the first six months of 2016 were the strongest in its company’s history as moderate levels of new supply paired with a strong appetite by e-commerce and other companies created the tightest market for tenants since the first internet boom of the early 2000s.

Warehouse

The San Francisco company owns or has interests in 3,347 buildings totaling 666 million square feet of property in 20 countries, including nearly 380 million square feet in the US. As such, the publicly traded REIT serves as a bellwether stock for the global warehouse and logistics market.

The REIT’s same-store net operating income increased 6.1% in the second quarter, securing an average 17.8% rent increase at lease expirations while delivering $621 million in new projects. Prologis had more than $3.7 billion in cash liquidity, its highest on record.

“All in all, the last six months have been the best in our company’s history,” said Hamid Moghadam, chairman and CEO of San Francisco-based Prologis (NYSE:PLD). “E-commerce and supply chain reconfiguration continue as big drivers of demand for our product. The Class A market is where the action is.”

Building Fast, Leasing Faster

CoStar and other CRE services firms, including CBRE Group, Inc. and JLL, noted the increasingly limited availability of U.S. industrial space at midyear as online sellers, third-party logistics firms, food and beverage and consumer goods firms scoop up newly constructed bulk warehouses and other industrial buildings as fast as they are built.

Even though developers added 158 million square feet of new warehouse/distribution space over the past 12 months, the overall vacancy rate for industrial property continued to inch down to 5.5% as of June 30 of this year.

According to a preliminary analysis by CoStar of midyear logistics and industrial property leasing data, that’s nearly 2 percentage points lower than the 2004-2007 expansion cycle, and within a few basis points of the lowest vacancy rate for industrial property since the Internet-driven demand boom of the late 1990s and early 2000s.

CBRE said it expects the global economy will continue to sustain demand for industrial space.

“While we’ve had some shocks to the global economy, the U.S. economy still is moving along at a slow and steady space and that will sustain industrial demand,” said Jeffrey Havsy, CBRE chief economist for the Americas. “Retail sales have been above expectations, posting pretty strong gains in April and May. That will help both the retail and industrial sectors.”

More than 210.5 million square feet of industrial space was absorbed by tenants over the last year, according to CoStar. The nearly 46.9 million square feet of net absorption in the second quarter, while down just under 10% from a year earlier, remains consistent with the average pace of demand growth throughout the long expansion, said CoStar Senior Real Estate Economist Shaw Lupton, in a preview of the company’s midyear industrial market review and forecast webinar scheduled for July 28.

Link to article: Demand for Warehouse Space Skyrockets